Redefining Clarity: The Indianapolis Crime Dashboard's Journey from Data to Insight
Dear Data & Analytics Professional,
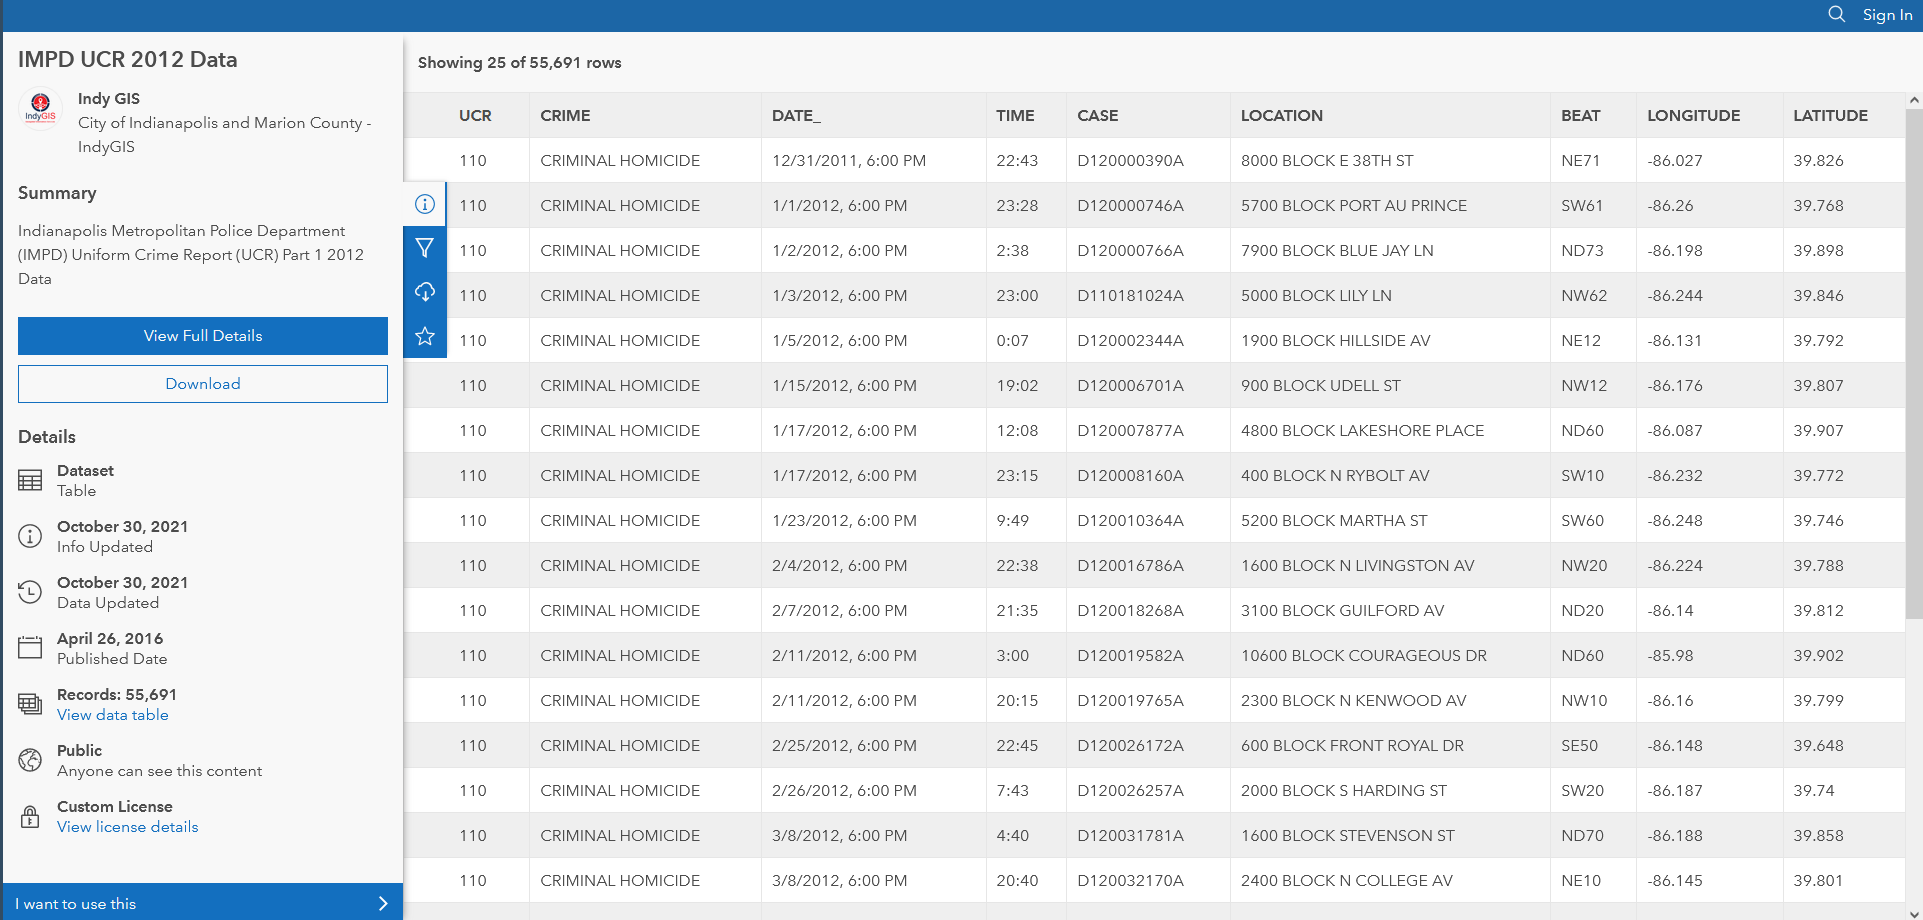
In the rapidly evolving landscape of data analysis and visualization, the power of simplicity, accessibility, and efficiency cannot be overstated. It’s with great excitement that I introduce to you the Indianapolis Crime Dashboard for the year 2012, a testament to the transformative power of R—a robust, open-source platform that brings complex data to life, exemplified by the comprehensive “IMPD UCR 2012 Data” dataset.
This dataset, is part of the Uniform Crime Reporting (UCR) Program, for Indianapolis and Marion County – IndyGIS, standardizes crime data collection across the United States, facilitating analysis and comparison. It provides detailed insights into various crime incidents, their types, locations, and other relevant information, making it a valuable resource for understanding crime patterns and trends in Indianapolis during that year.
At the heart of this innovative dashboard is the utilization of R, a decision driven not just by its advanced analytical capabilities but also by its cost-saving potential. R’s open-source nature offers a financially savvy solution by eliminating the need for expensive licenses associated with proprietary software, thereby significantly reducing the total cost of ownership while maintaining top-notch functionality.
The dashboard’s inception begins with a careful selection of R packages—such as tidyverse for its unparalleled data manipulation prowess and leaflet for dynamic mapping. These tools lay the foundational stones for a dashboard that doesn’t just present data but tells a story that is engaging and easily digestible for its audience.
A key feature of R that particularly stands out is its adeptness at handling a variety of file formats, including legacy formats. This ensures seamless integration of data, whether it’s sourced from modern applications or archived records, without necessitating costly conversions. This flexibility in data ingestion underscores R’s position as a versatile tool in your analytical arsenal.
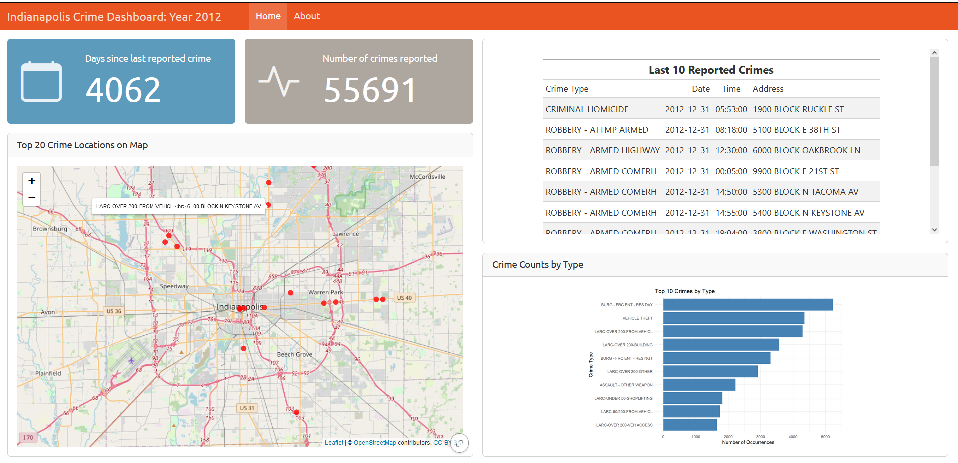
Through meticulously crafted visual cues like value boxes and interactive maps, the dashboard provides immediate insights into the most pertinent crime data. Its user-centric design ensures that complex datasets are not just visible but are made understandable and actionable for a diverse audience, empowering them with real-time insights into crime trends and distributions across Indianapolis.
Furthermore, R’s capabilities are augmented by packages like ggplot2 and Plotly, allowing for the creation of dynamic, 3D, and animated graphics, thereby enriching the dashboard’s visual appeal and analytical depth. This fusion of cost-efficiency and advanced functionality is what sets the Indianapolis Crime Dashboard apart.
In crafting this dashboard, we’ve transcended traditional data analysis to deliver a tool that not only informs but engages and empowers its users. It’s a vivid demonstration of how advanced technology, when combined with a user-centric approach, can make even the most complex data accessible and actionable for all.
I invite you to explore the future of data analysis with us, where insights are not just gleaned but experienced, all through the lens of the cost-effective, versatile capabilities of R.
With warm regards and anticipation for a data-driven future,
Lindsay Alston
Sr. Business Analyst | R enthusiast.
P.S. While diving into the depths of the Indy dataset and crafting the dashboard, not a single byte of data was left unturned, and surprisingly, no coffee mugs were broken in the exhilaration of discovery.