Grab Your
Copy Today!
$19.99
Discover how evidence-based analytics can transform the way you interpret data and support business decisions.
Data Think challenges the way modern organizations analyze data. Instead of reacting to every change in the numbers, it introduces a practical framework for distinguishing meaningful signals from routine variation. Designed for data analysts, analytics leaders, and decision makers, this book shows how to build evidence before explanation—leading to better analysis, better decisions, and better business outcomes.
Modern analytics has never had more data, more computing power, or more sophisticated tools.
Yet many organizations still struggle to turn analysis into trusted insights and confident recommendations.
Why?
Because most analytics tells us what happened. It rarely helps us determine whether the available data provides sufficient evidence to support an insight, a recommendation, or a business decision.
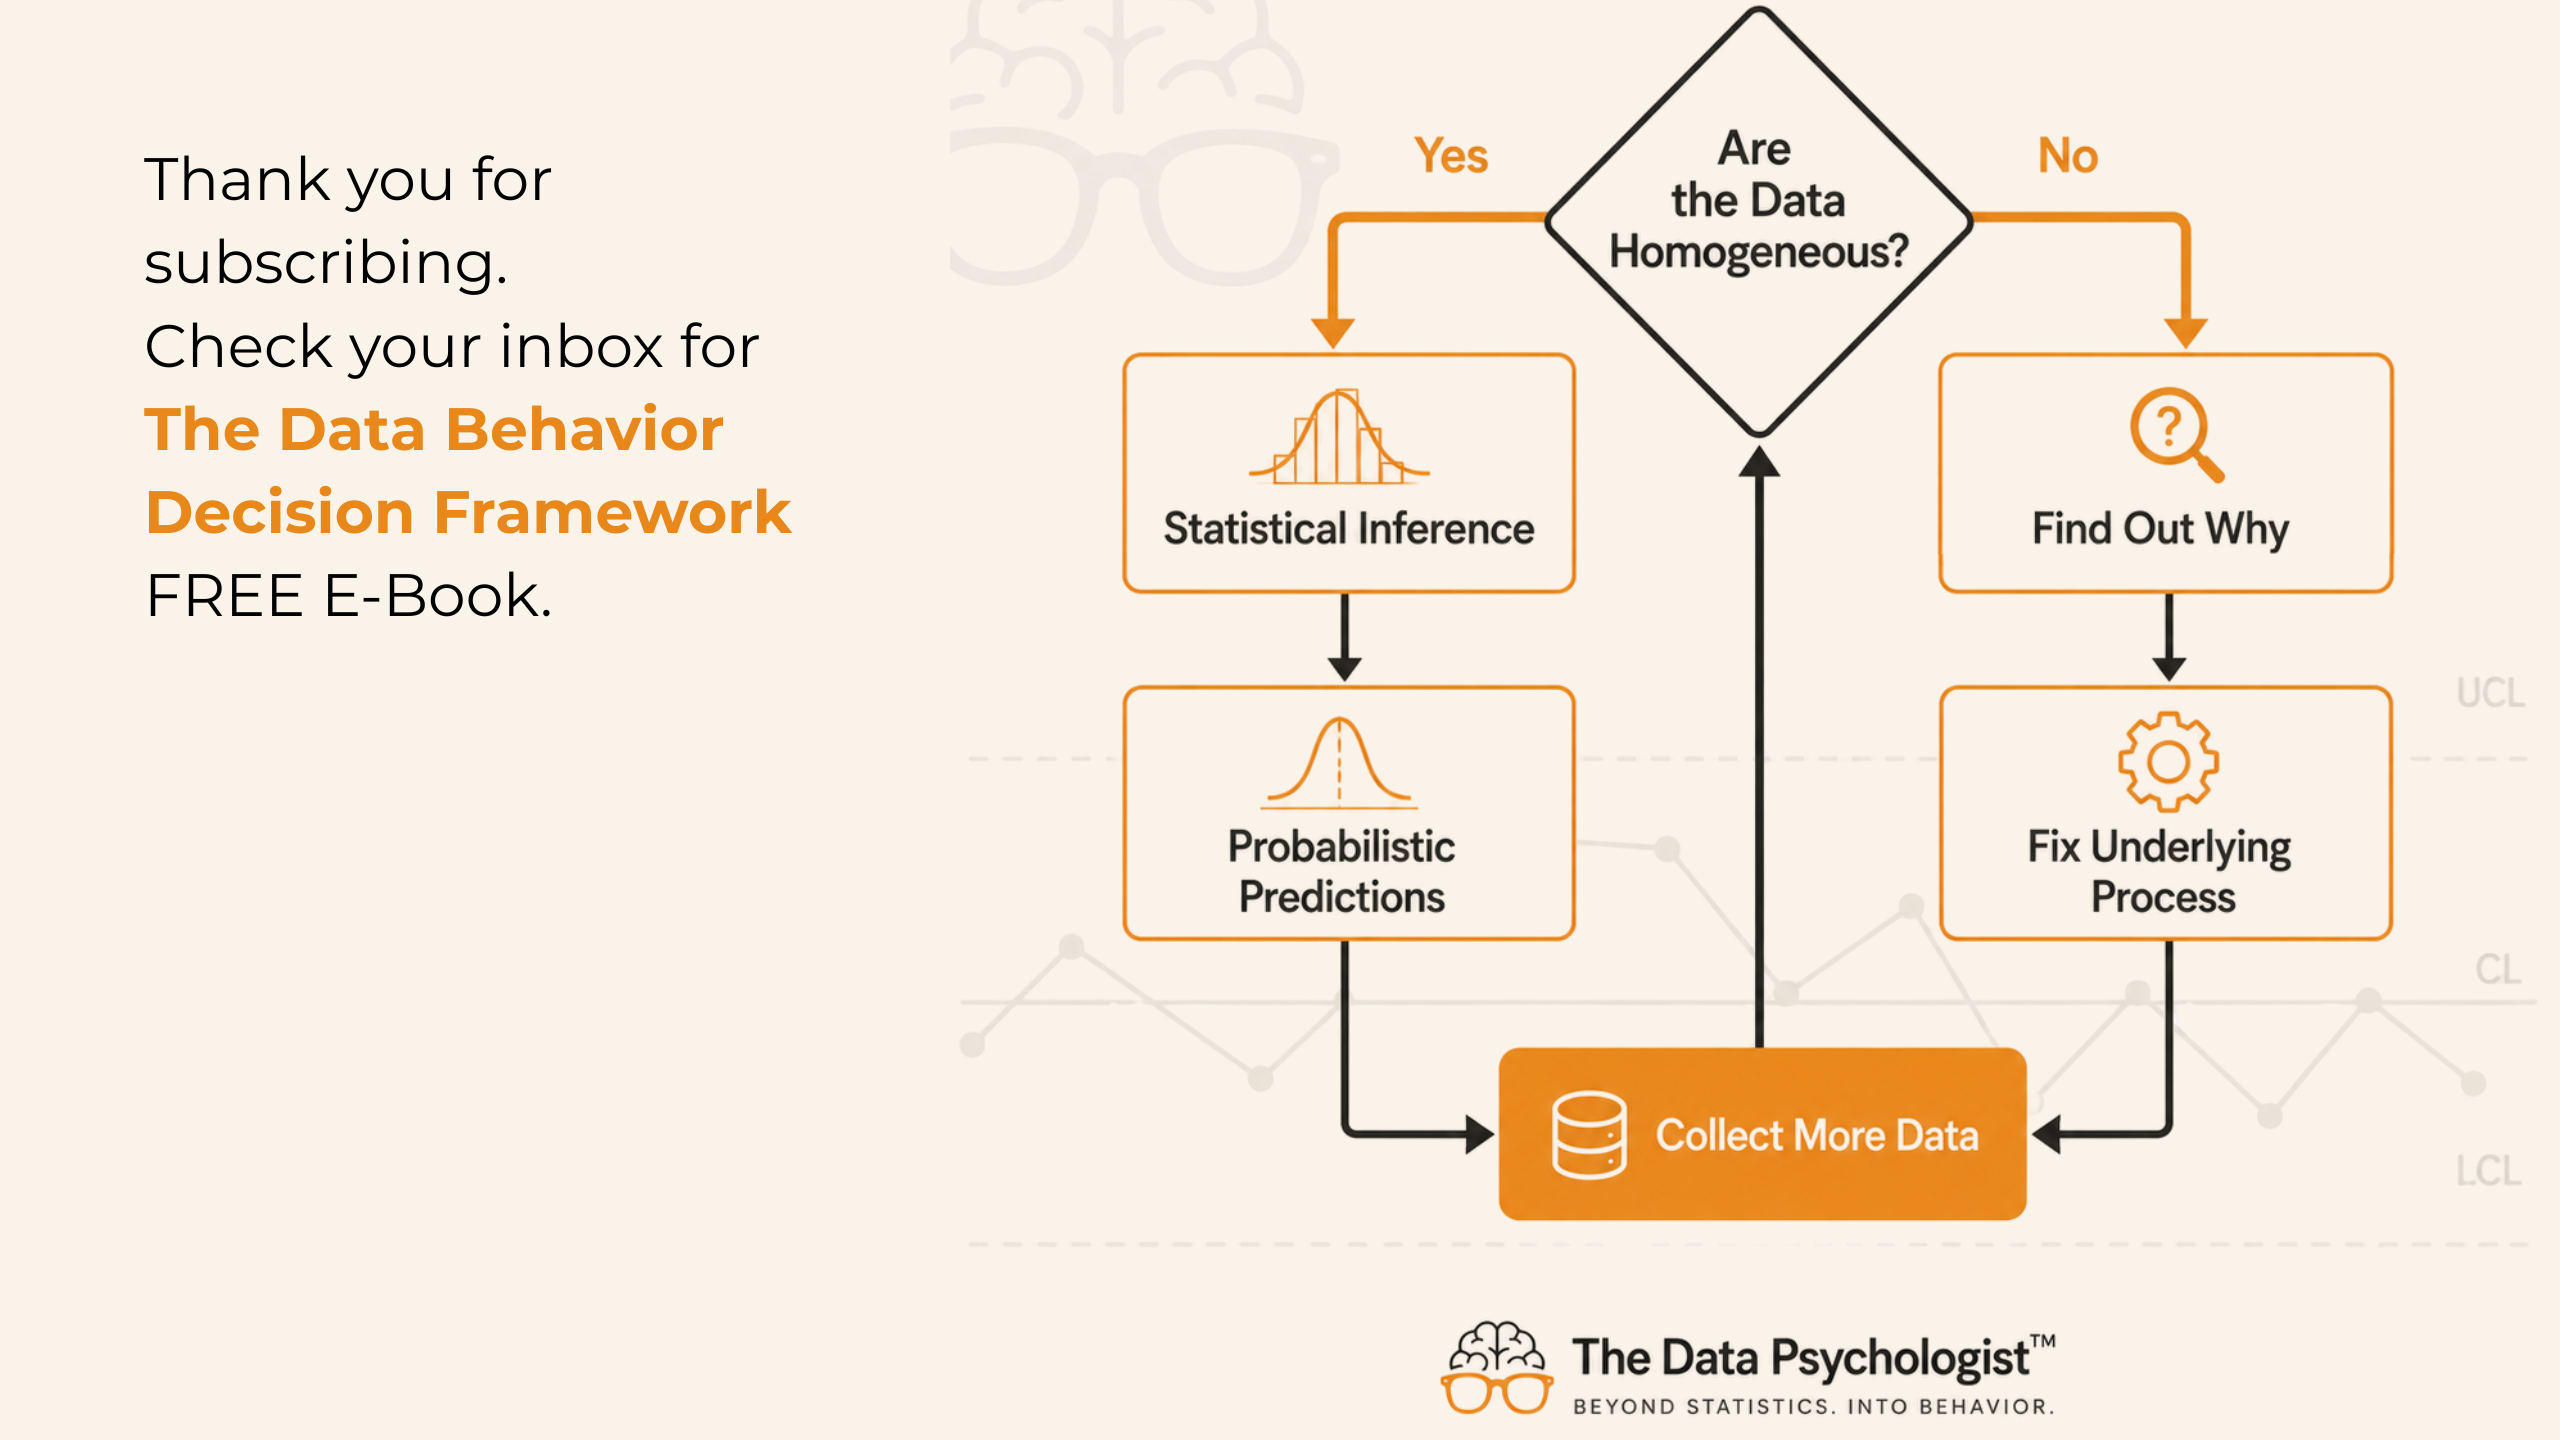
Data Think introduces the Systems Performance Framework—a practical approach for evaluating whether the available data supports meaningful conclusions before explaining, recommending, or acting.
Download the first three chapters and discover how evidence-based analytics can transform the way you interpret data, deliver insights leaders trust, and make better business decisions.
Learn:
Why more dashboards don't necessarily lead to better decisions.
Why descriptive analytics alone rarely justifies action.
The question every data analyst should ask before explaining, predicting, or recommending.
How the Systems Performance Framework helps determine whether the available data provides sufficient evidence to support meaningful insights and better decisions.
© 2026 Lindsay Alston, Inc. All rights reserved.