Days since last reported crime
4062
Number of crimes reported
55691
| Last 10 Reported Crimes | |||
|---|---|---|---|
| Crime Type | Date | Time | Address |
| CRIMINAL HOMICIDE | 2012-12-31 | 05:53:00 | 1900 BLOCK RUCKLE ST |
| ROBBERY - ATTMP ARMED | 2012-12-31 | 08:18:00 | 5100 BLOCK E 38TH ST |
| ROBBERY - ARMED HIGHWAY | 2012-12-31 | 12:30:00 | 6000 BLOCK OAKBROOK LN |
| ROBBERY - ARMED COMERH | 2012-12-31 | 00:05:00 | 9900 BLOCK E 21ST ST |
| ROBBERY - ARMED COMERH | 2012-12-31 | 14:50:00 | 5300 BLOCK N TACOMA AV |
| ROBBERY - ARMED COMERH | 2012-12-31 | 14:55:00 | 5400 BLOCK N KEYSTONE AV |
| ROBBERY - ARMED COMERH | 2012-12-31 | 19:04:00 | 3800 BLOCK E WASHINGTON ST |
| ROBBERY - STRARM HIWAY | 2012-12-31 | 01:30:00 | E 21ST ST & N BANCROFT ST |
| ROBBERY - STRARM HIWAY | 2012-12-31 | 02:15:00 | 1400 BLOCK S BELMONT AV |
| ROBBERY - STRARM OIL ST | 2012-12-31 | 00:01:00 | 1900 BLOCK PROSPECT ST |
The “Indianapolis Crime Dashboard: Year 2012” provides a comprehensive overview of crime data reported by the Indianapolis Metropolitan Police Department (IMPD) to the FBI as part of the Uniform Crime Report (UCR) Part 1 for the year 2012. The dashboard is designed with a user-friendly interface, employing a columnar orientation and the Yeti theme to enhance readability and engagement.
The dashboard’s construction begins with the necessary R package imports, including tidyverse for data manipulation, duckdb and DBI for database interaction, gt for table generation, leaflet for interactive maps, and DT for interactive data tables. These packages form the foundation for data handling, analysis, and visualization within the dashboard.
Data is initially ingested from a CSV file, converted to an R data file for efficiency, and then loaded into an in-memory DuckDB database. This approach optimizes performance for subsequent data manipulation and analysis.
The crime data undergoes transformation to facilitate analysis, such as converting date strings to Date objects and calculating the time elapsed since each crime occurred. This preprocessing is crucial for the subsequent analytical components of the dashboard.
Key components of the dashboard include:
Value Boxes: These display the days since the last reported crime and the total number of crimes reported, providing quick, essential insights at a glance.
Map Visualization: A leaflet map highlights the top 20 crime locations, aggregating data by coordinates and displaying the most common crime type and associated addresses for each location. This spatial representation offers an intuitive understanding of crime distribution across Indianapolis.
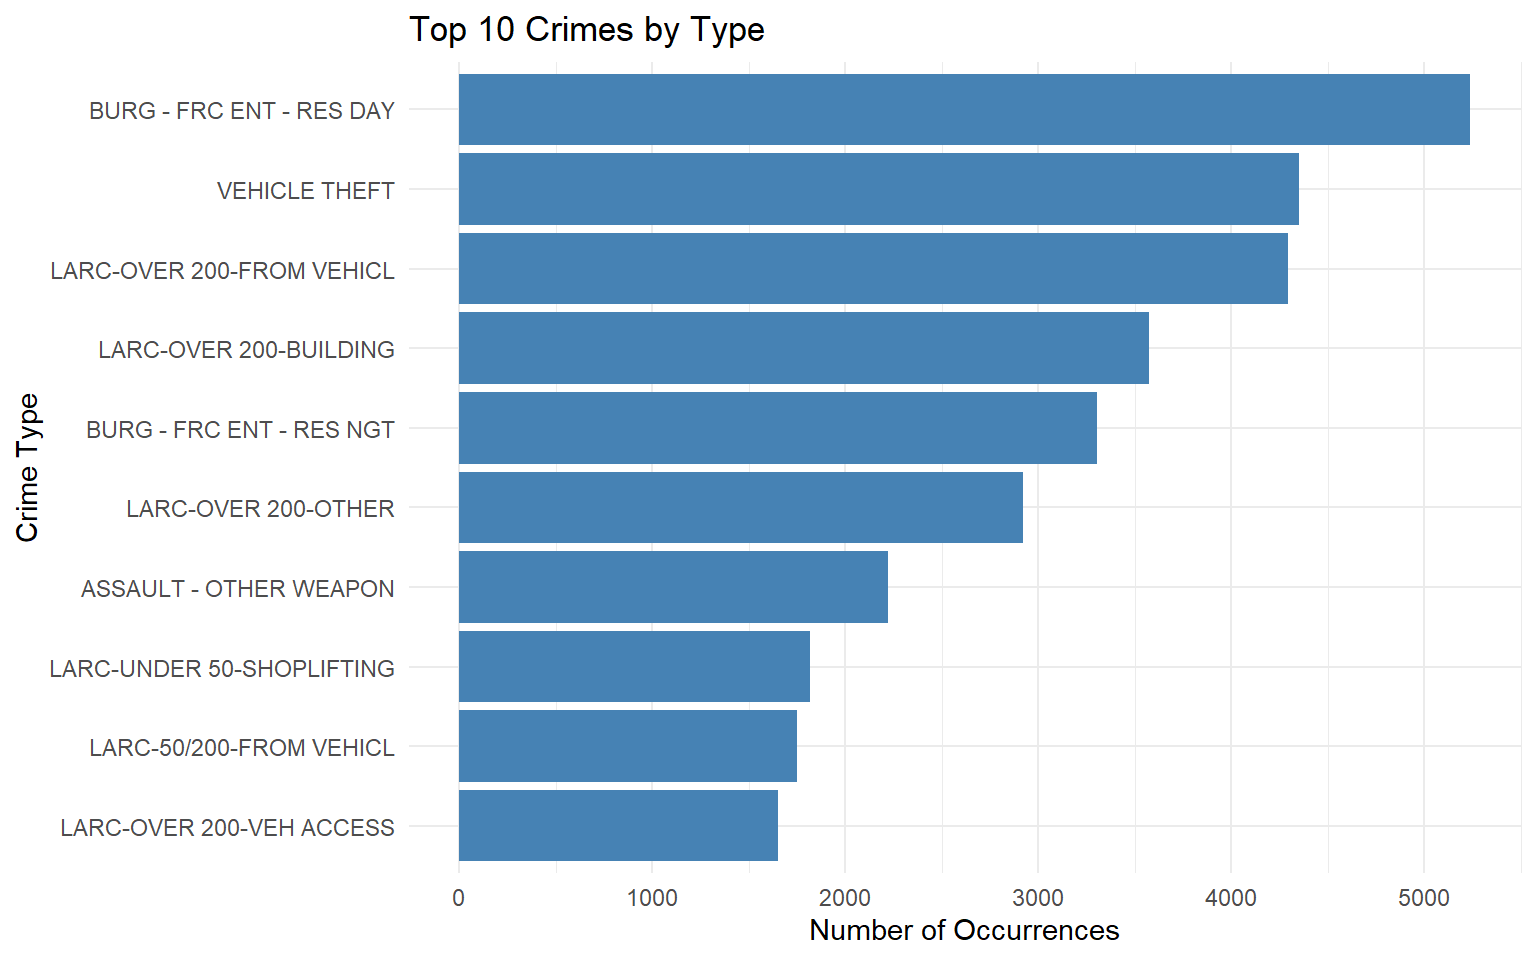
Bar Chart: A bar chart visualizes the top 10 crimes by type, based on the number of occurrences. This chart offers a clear depiction of the most prevalent crime types, enhancing the dashboard’s analytical depth.
Recent Crimes Table: A table displays the most recent crimes, listing their type, date, time, and address. This component provides detailed insights into the latest criminal activities, contributing to situational awareness.
Disconnection from Database: The final step involves cleanly disconnecting from the DuckDB database, ensuring no resources are left allocated unnecessarily.
The dashboard sources its data from the IMPD UCR Part 1 2012 Data, accessible through a provided URL. The UCR program, administered by the federal government, standardizes crime reporting across the country, and the Part 1 crime groups include serious offenses such as murder, rape, robbery, aggravated assault, burglary, larceny, and vehicle theft.
A data dictionary is also provided, offering detailed explanations of the dataset’s variables, enhancing the transparency and usability of the crime data within the dashboard.
This dashboard serves as a powerful tool for analyzing and visualizing crime trends in Indianapolis for the year 2012, offering valuable insights for law enforcement, policymakers, and the general public.
Data URL: https://data.indy.gov/datasets/IndyGIS::impd-ucr-2012-data/explore
Data Dictionary: https://citybase-cms-prod.s3.amazonaws.com/f19286803e50414aac012b24dd88c94c.pdf