The Data Science Workflow: Essential R Packages from A-Z
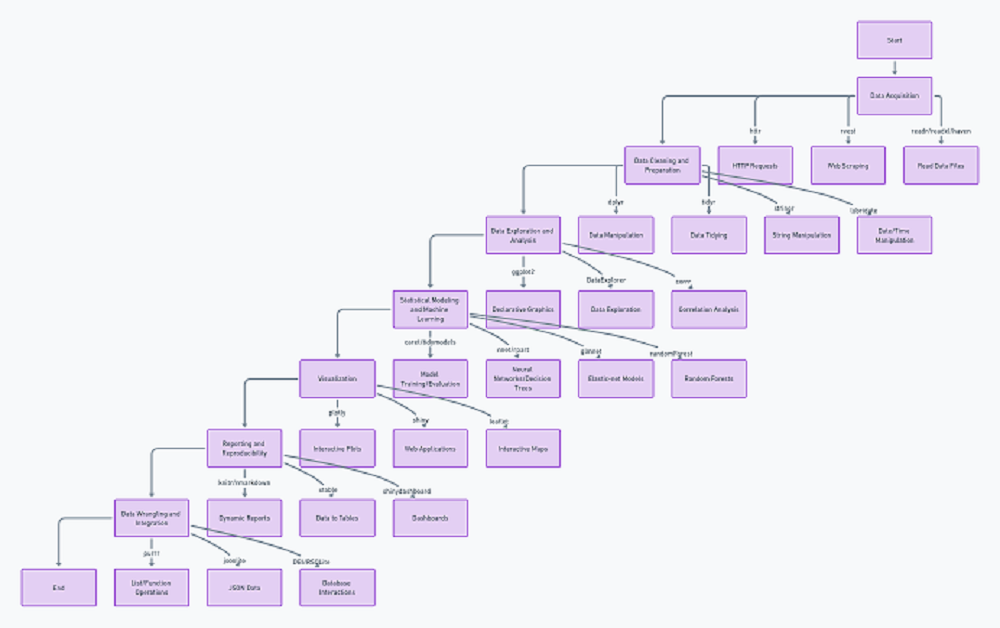
Image credit: cryptopolitian.com
The data science journey encompasses a series of interconnected steps:
from initial data acquisition to the final presentation of results. Each phase demands a specific set of tools and methodologies, particularly when working within the R programming environment. This post delves into the essential R packages that streamline this workflow, offering a comprehensive toolkit for aspiring and seasoned data scientists alike.
Data Acquisition: The Starting Point
Data acquisition is the first step in any data science project. In R, packages like ‘httr’ and ‘rvest’ are invaluable for scraping web data and making API requests. For importing data from various file formats, ‘readr‘ for flat files, ‘readxl‘ for Excel files, and ‘haven’ for data from SPSS, SAS, and Stata are go-to choices.
Cleaning and Preparing Your Canvas
Once the data is in hand, the next step is cleaning and preparing it for analysis. The ‘dplyr’ package is indispensable for data manipulation, while ‘tidyr’ assists in tidying data into a more workable format. ‘stringr’ offers a suite of string operations, and ‘lubridate’ simplifies date-time data handling.
Exploratory Data Analysis: Unveiling Insights
Exploratory Data Analysis (EDA)
(EDA) is crucial for understanding underlying patterns. **ggplot2** stands out for its comprehensive and aesthetically pleasing visualizations. For a more automated approach to EDA, ‘DataExplorer’ provides functions to streamline this process, and ‘corr’ aids in exploring correlations between variables.
Modeling: The Heart of Data Science
When it comes to statistical modeling and machine learning, R boasts a rich set of packages. ‘caret’ and the newer ‘tidymodels’ framework offer a unified interface for model training and evaluation across a wide variety of algorithms. Packages like ‘nnet’ for neural networks, ‘rpart. for decision trees, ‘glmnet’ for elastic-net models, and ‘randomForest’ for random forest models are specific to certain types of analyses.
Visualization: Beyond Basic Charts
For more dynamic and interactive visualizations, ‘plotly’ is an excellent tool, while ‘leaflet’ allows for the creation of interactive maps. To bring data analysis to life, ‘shiny’ enables the creation of interactive web applications directly from R.
Reporting and Dashboarding: Telling the Story
Finally, communicating results effectively is paramount. ‘knitr’ and ‘rmarkdown’ facilitate the integration of R code within reports and documents, turning analyses into reproducible narratives. For dashboard creation, ‘shinydashboard’ provides a framework within the ‘Shiny’ ecosystem.
In conclusion, the R language offers a comprehensive suite of packages that cover the entire data science workflow. From the initial data acquisition to the final presentation of insights, R’s extensive package ecosystem supports every step of the data science journey. Whether you’re just starting out or looking to expand your toolkit, these packages provide a solid foundation for tackling a wide range of data science challenges.