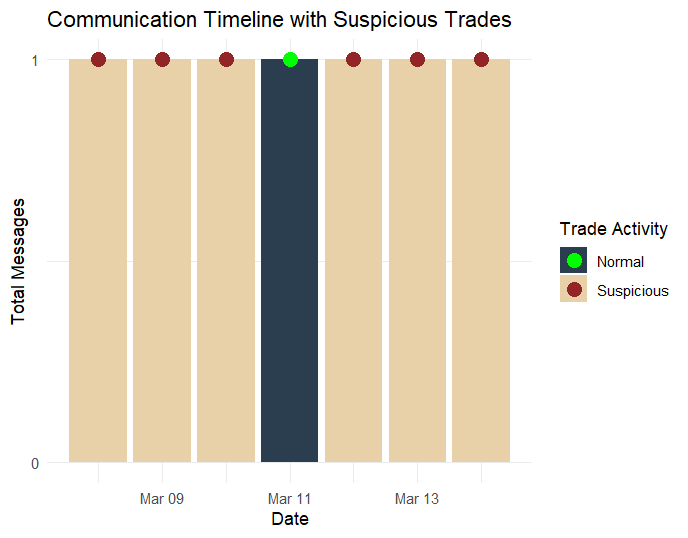
The above bar plot is the final work product from the attorney’s analysis.
It visualizes the frequency of communications over a series of dates, with each bar representing the total number of messages sent on a given day.
Overlaid on these bars are points that are color-coded: red points indicate days where suspicious trading activity was noted, while the green point represent days with normal activity.
In this case, the red dots are designed to draw attention to specific dates — here, it appears that the 9th, 10th, and 12th of March have been flagged as suspicious.
The presence of these red indicators could suggest that on these dates, there was an anomaly in communication patterns that coincides with trading activity considered suspicious, possibly implying insider trading or other irregularities worth investigating.
The y-axis shows the count of messages for each day, allowing the attorney to quickly identify days with unusually high or low communication volumes.
The x-axis is marked with the dates of the month of March.
The legend on the right distinguishes between the types of trade activity for quick reference.
Overall, the plot is a tool for the attorney to pinpoint potential leads that merit further examination in the context of the investigation into insider trading.