Understanding what drives impressions and engagement is key to growing your audience and building meaningful connections.
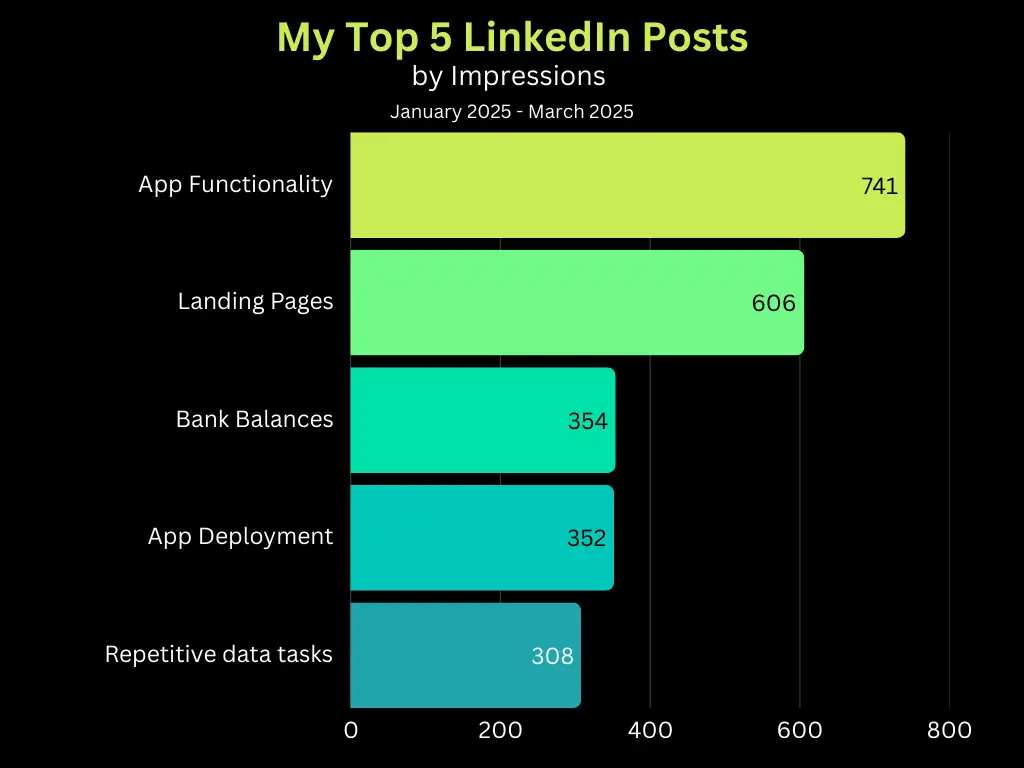
After reviewing my top 5 LinkedIn posts by impressions, some patterns are starting to emerge — and they reveal valuable insights about what resonates with my audience.
From high-reach posts with zero engagement to others with smaller reach but higher interaction rates, this analysis uncovers what’s working, what’s not, and how to adjust my strategy for even greater impact.
Let’s break down the performance of each post and explore how to turn impressions into meaningful engagement. 👇
1. The functionality is there…
- Impressions: 744 (Highest)
- Reactions: 0
- Comments: 0
- Reposts: 0
- Engagement Rate: 0%
This post had the highest reach in terms of impressions but had no engagement (reactions, comments, or reposts). This suggests that while the topic or headline might have attracted views, the content may not have inspired enough interaction. Improving the call to action or adding more engaging elements (e.g., questions, polls) could increase engagement.
2. Building landing pages…
- Impressions: 606
- Reactions: 11 (Highest reaction count)
- Comments: 0
- Reposts: 0
- Engagement Rate: 1.8%
This post had strong engagement in terms of reactions but no comments or reposts. The engagement rate of 1.8% is solid, indicating that the content resonated with viewers. Encouraging more discussion by asking a question or providing a clear prompt could further boost interaction.
3. Let’s pick up where Part…
- Impressions: 354
- Reactions: 3
- Comments: 0
- Reposts: 0
- Engagement Rate: 0.8%
Although this post had a moderate reach, the engagement was low. The lower engagement rate suggests that the content may not have been compelling enough or lacked a strong call to action. It might benefit from more interactive content or a clearer message.
4. How I Deployed My Shiny…
- Impressions: 352
- Reactions: 6
- Comments: 1
- Reposts: 0
- Engagement Rate: 1.9%
This post performed well with a balanced mix of reactions and a comment. The topic (technical and instructional) appears to have sparked some interest. Increasing the engagement further might involve including a CTA encouraging readers to share their own experience or feedback.
5. Repetitive data tasks…
- Impressions: 308
- Reactions: 5
- Comments: 2
- Reposts: 0
- Engagement Rate: 2.2% (Highest)
This post had the highest engagement rate, indicating that the content was highly relevant to my audience despite having fewer impressions. The higher comment count suggests that it sparked some conversation, which is a positive sign for building engagement.
Key Takeaways:
- The post about “Repetitive data tasks” had the highest engagement rate, showing that highly relevant, actionable content tends to drive more interaction.
- The post about “Building landing pages” had the highest reaction count, indicating that technical or practical content resonates well.
- The post about “The functionality is there…” had the highest impressions but failed to engage, suggesting that reach without engagement is not enough to build traction.
- Improving comments and reposts by including clear calls to action and engaging questions could increase overall interaction.
- Encouraging more discussion and interaction through direct prompts and questions can help improve engagement rates.