Disparities in Uninsured Rates Across States
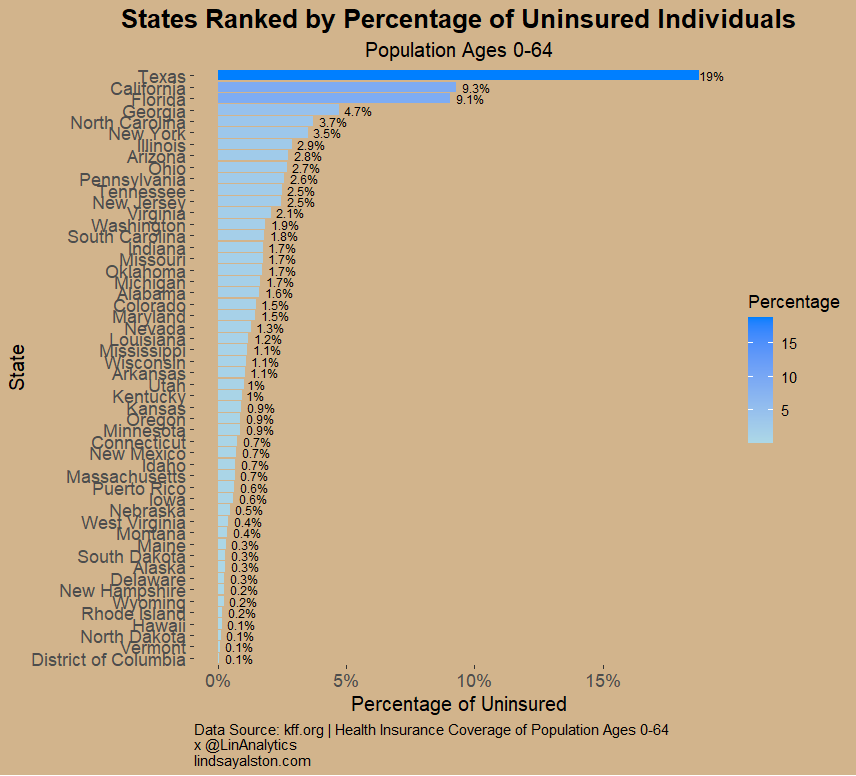
The visualization ranks U.S. states by the percentage of uninsured individuals aged 0-64, revealing significant disparities in healthcare coverage across the nation. Texas stands out with the highest uninsured rate of 19%, which is more than double that of California and Florida, the next highest states, at 9.3% and 9.1%, respectively. This stark gap highlights the unique challenges Texas faces in ensuring healthcare access for its residents. Beyond these top states, Georgia also has a relatively high uninsured percentage, contributing to a concentration of uninsured populations in southern states. In contrast, states like Massachusetts, Vermont, and Hawaii have successfully kept their uninsured rates below 1%, reflecting effective healthcare policies or systems.
Patterns in Coverage Gaps
The chart underscores the wide range of uninsured rates, with many states clustering between 1% and 5%, indicating moderate success in providing coverage but leaving room for improvement. Smaller states such as Wyoming, Vermont, and the District of Columbia have managed to achieve near-universal coverage, showcasing the potential for effective healthcare strategies in addressing this issue. Southern states with higher percentages may face structural or economic barriers to coverage, while the success of states like Massachusetts and Vermont could serve as models for improvement.
Chart Design and Highlights
The design of the chart, with its gradient color scale from light to dark blue, effectively visualizes the differences in uninsured rates across states. The horizontal orientation and clear percentage labels make comparisons straightforward, and Texas’s outlier status is particularly emphasized through its annotation, drawing attention to the magnitude of its uninsured population. The visual elements work together to tell a compelling story about the distribution of uninsured rates nationwide.
Opportunities for Further Analysis
These disparities raise critical questions about the socio-economic and policy factors driving uninsured rates. Further analysis could explore trends over time, the correlation between uninsured rates and indicators such as income or employment, and the impact of specific healthcare policies. For example, tracking changes in coverage over time or studying successful policies in states like Massachusetts could offer actionable strategies for states with higher rates of uninsured individuals. Overall, the visualization highlights the urgent need for targeted efforts to address healthcare accessibility, particularly in states with the highest uninsured rates, and provides a strong foundation for informing policymakers and advocates working to close the coverage gap.