
Process Behavior Chart Data Analysis Report
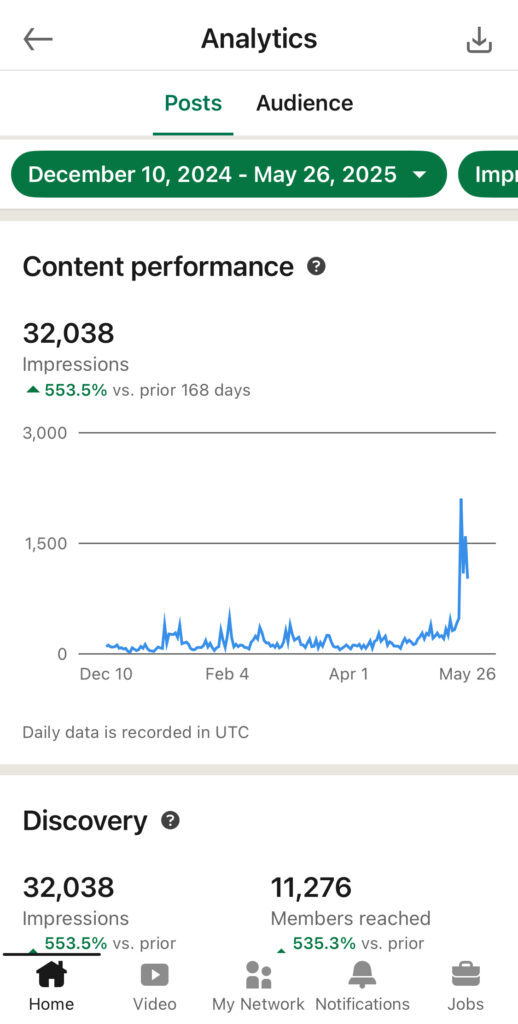
Monitoring Period: December 10, 2024 – May 25, 2025
Total Observations: 167 consecutive daily data points
Subject: LinkedIn Activity – Lindsay Alston
Focus Period: Day 152 onward (May 10–25, 2025)
1. Overview
This analysis reviews LinkedIn activity over a continuous 167-day period using a process behavior chart (control chart). From Day 1 (December 10, 2024) through Day 151 (May 9, 2025), the process exhibited expected variation centered around a stable mean. However, beginning on Day 152 (May 10, 2025), the behavior pattern shifts dramatically.
2. Control Chart Parameters
- Center Line (CL): 185.74
- Standard Deviation (σ): 67.55
- Upper Control Limit (UCL): 388.39
- Lower Control Limit (LCL): Truncated at 0 (computed as -16.92)
- Total Points Out of Control: 11
3. Detection Rule Evaluation
Rule 1: Points Outside the Limits
“A single point outside the computed limits should be taken as a signal of the presence of an assignable cause with a dominant effect.”
- Finding: 11 individual data points fall above the UCL.
- Interpretation: Indicates dominant assignable causes — statistically significant and not due to common variation.
Rule 2: Runs About the Central Line
“Eight successive values on the same side of the central line indicate a weak but sustained assignable cause.”
- Finding: A sequence of 15+ consecutive points above the center line is observed beginning May 10, 2025.
- Interpretation: Strong evidence of a sustained process shift, even if within control limits.
Rule 3: Runs Near the Limits
“Three out of four successive values in the upper 25% or lower 25% of the region between the limits suggest a moderate but sustained assignable cause.”
- Finding: Multiple instances where three of four consecutive points fall in the upper 25% band between CL and UCL.
- Interpretation: Confirms directional trend pressure in process output.
Rule 4: Runs Beyond Two-Sigma
“Two out of three successive values more than two-sigma from the central line indicate a moderate but sustained assignable cause.”
- Finding: Several patterns from May 10 onward meet this criterion, with values above the +2σ threshold but below the UCL.
- Interpretation: Supports the presence of a real and consistent upward shift.
Rule 5: Runs Beyond One-Sigma
“Four out of five successive values beyond one-sigma from the central line may indicate a moderate but sustained assignable cause.”
- Finding: Multiple examples post-May 10 where four of five points exceed the +1σ level.
- Interpretation: Additional evidence of systemic change, not random fluctuation.
4. Summary of Findings
| Detection Rule | Violated? | Type of Signal Detected |
|---|---|---|
| Rule 1 – Outside Limits | Yes | Dominant assignable cause |
| Rule 2 – Run Above CL | Yes | Weak but sustained shift |
| Rule 3 – Near Limits | Yes | Moderate directional trend |
| Rule 4 – Beyond 2σ | Yes | Moderate but sustained change |
| Rule 5 – Beyond 1σ | Yes | Sustained, moderate deviation from the baseline |
5. Conclusion
All five detection rules indicate the presence of assignable causes beginning on Day 152 (May 10, 2025). This suggests a statistically significant shift in system behavior that cannot be attributed to random variation. The magnitude and duration of this change support the conclusion that a new behavioral process is emerging.
Further investigation is warranted to identify the root cause of this shift — whether strategic, external, or algorithmic in nature — and to determine whether control limits should be re-established based on the new process behavior.


Leave a Reply