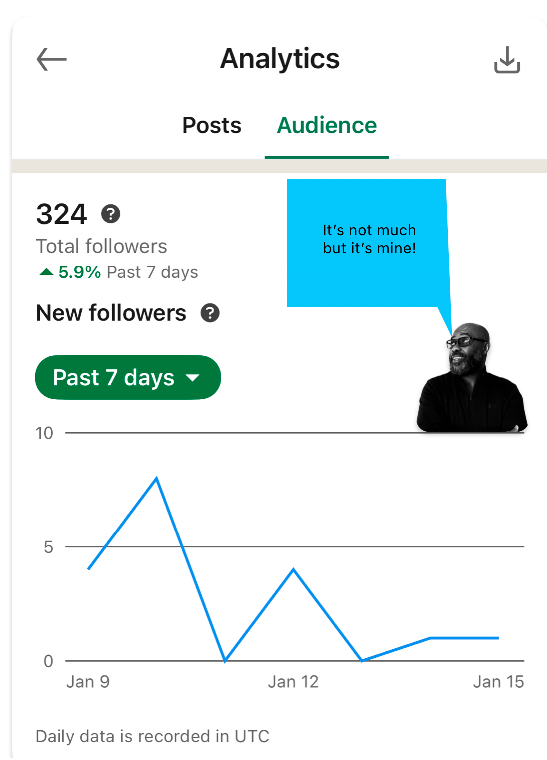
In the past month, I set out to measure a key question: Does consistent activity on LinkedIn lead to measurable follower growth? Tracking 53 new followers over 30 days provided an average growth rate of 1.77 followers per day. While this appears modest, the data analysis reveals insights into what drives engagement and whether consistent action aligns with follower growth.
Step 1: Defining the Question
The goal was to answer: What factors drive follower growth on LinkedIn?
We hypothesized that consistent posting and engagement (e.g., comments, shares) would correlate with increased daily follower counts.
To test this, two time ranges were analyzed:
- Range 1: July 4, 2024 – August 4, 2024 (Periods of consistent activity).
- Range 2: December 6, 2024 – January 6, 2025 (Periods of comparable activity).
Step 2: Analyzing the Results
The Welch Two Sample t-test was used to determine if there was a statistically significant difference in follower growth between the two periods.
Welch Test Results:
- t-statistic: 0.0
- p-value: 1.0
- Mean New Followers:
- Range 1: 0.75 followers/day
- Range 2: 0.75 followers/day
Interpretation:
The p-value of 1.0 indicates no statistically significant difference between the two periods. This suggests that consistent LinkedIn activity during these periods did not lead to measurable differences in follower growth rates.
Step 3: Turning Insights into Action
While the data didn’t show a clear link between activity levels and follower growth, it provides actionable insights for refining future strategies:
- Engagement Patterns:
Analyze content types during Range 1 to identify potential drivers of steady growth (e.g., post topics, formats). - Content Experimentation:
Test different types of posts (educational vs. opinion-based) to measure engagement more effectively. - Timing and Frequency:
Reassess posting schedules to determine if timing affects visibility and growth rates.
Step 4: Measuring Long-Term Success
Small datasets, like a single month of LinkedIn growth, may not always yield statistically significant results, but they build the foundation for more refined experiments. For example:
- Track data over a longer period to reduce variability.
- Focus on specific variables, such as post format or audience demographics, for targeted insights.
The Takeaway
Growth doesn’t happen by chance—it’s the result of actionable strategies driven by data. Tracking incremental progress and analyzing results refine approaches to achieve bigger outcomes.
From a data analysis perspective, even modest gains like 53 followers in 30 days demonstrate the power of tracking metrics, evaluating trends, and aligning actions with insights.
The question is: Are you measuring what matters to guide your next steps?
LinkedIn Data:
| Date 7/4/24-8/4/24 | New Followers | Date 12/6/24-1/6/25 | New Followers |
|---|---|---|---|
| 2024-07-04 | 2 | 2024-12-06 | 0 |
| 2024-07-05 | 0 | 2024-12-07 | 0 |
| 2024-07-06 | 0 | 2024-12-08 | 0 |
| 2024-07-07 | 2 | 2024-12-09 | 0 |
| 2024-07-08 | 2 | 2024-12-10 | 0 |
| 2024-07-09 | 0 | 2024-12-11 | 0 |
| 2024-07-10 | 2 | 2024-12-12 | 2 |
| 2024-07-11 | 0 | 2024-12-13 | 0 |
| 2024-07-12 | 0 | 2024-12-14 | 1 |
| 2024-07-13 | 0 | 2024-12-15 | 1 |
| 2024-07-14 | 1 | 2024-12-16 | 0 |
| 2024-07-15 | 2 | 2024-12-17 | 0 |
| 2024-07-16 | 2 | 2024-12-18 | 0 |
| 2024-07-17 | 0 | 2024-12-19 | 0 |
| 2024-07-18 | 0 | 2024-12-20 | 0 |
| 2024-07-19 | 0 | 2024-12-21 | 0 |
| 2024-07-20 | 0 | 2024-12-22 | 2 |
| 2024-07-21 | 0 | 2024-12-23 | 1 |
| 2024-07-22 | 4 | 2024-12-24 | 2 |
| 2024-07-23 | 0 | 2024-12-25 | 0 |
| 2024-07-24 | 0 | 2024-12-26 | 0 |
| 2024-07-25 | 1 | 2024-12-27 | 3 |
| 2024-07-26 | 0 | 2024-12-28 | 0 |
| 2024-07-27 | 2 | 2024-12-29 | 2 |
| 2024-07-28 | 0 | 2024-12-30 | 0 |
| 2024-07-29 | 1 | 2024-12-31 | 0 |
| 2024-07-30 | 1 | 2025-01-01 | 0 |
| 2024-07-31 | 2 | 2025-01-02 | 2 |
| 2024-08-01 | 0 | 2025-01-03 | 4 |
| 2024-08-02 | 0 | 2025-01-04 | 2 |
| 2024-08-03 | 0 | 2025-01-05 | 0 |
| 2024-08-04 | 0 | 2025-01-06 | 2 |