Introduction
The three XmR charts reveal different behaviors in inflation dynamics across core, energy, and utility categories since 2020. Process Behavior Charts are uniquely valuable for distinguishing between common cause and special cause variation, which is essential in identifying structural changes, temporary spikes, or shifts in economic conditions.
Here is an analysis on the three Process Behavior Charts (XmR Charts) provided for the following CPI measures:
- Median Core Consumer Price Index (MEDCPIM158SFRBCLE)
- Median Consumer Price Index: Energy in U.S. City Median (CPIENGSL)
- Median Consumer Price Index: Fuels and Utilities in U.S. City Median (CUUR0000SAH2)
Median Core CPI MEDCPIM158SFRBCLE)
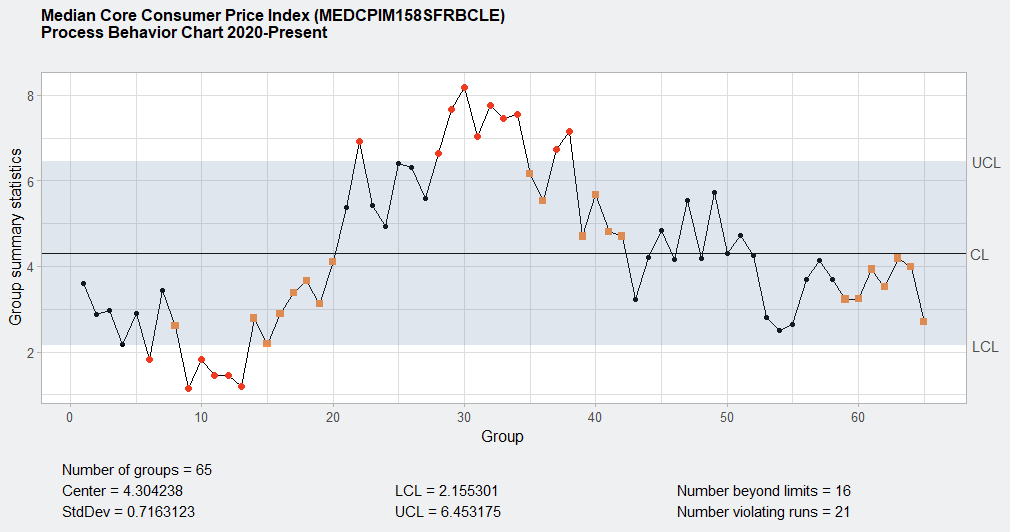
The chart for median core CPI displays a stable process in early 2020, followed by a pronounced rise starting mid-2021. A significant number of points exceed the upper control limit (UCL), especially during the sharp upward trend in 2021–2022, indicating special cause variation and confirming a fundamental change in the inflation process for core goods and services.
After peaking, the values descend sharply and remain consistently below the central line (CL), forming runs that violate statistical rules (21 violating runs in total). These violating runs reflect persistent, non-random behavior suggesting a corrective or disinflationary phase. The Center (mean) is 4.304238 with a narrow standard deviation of 0.7163123, establishing a relatively tight process under typical conditions.
There are 16 data points beyond control limits, many of which cluster around the inflation surge and retreat, suggesting that the core CPI experienced multiple periods of instability and correction since 2020. Notably, the recent data points fall well within control limits but hover near the lower control limit (LCL), highlighting a return to stability with a possible downward drift in pricing pressure.
Median CPI Energy (CPIENGSL)
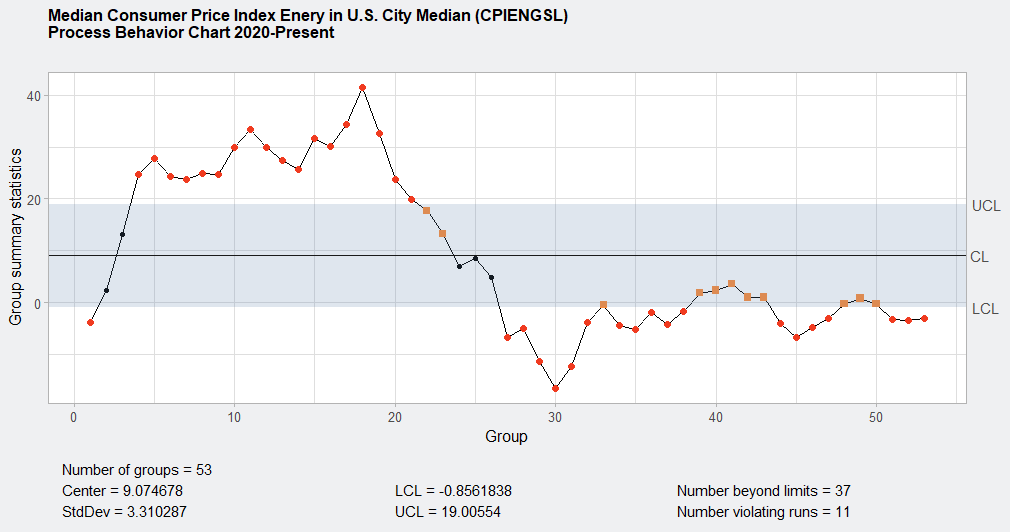
The behavior of the CPI energy subgroup is radically different from core inflation. This chart demonstrates extreme volatility, with numerous outliers both above and below control limits. With 37 points beyond the control limits and only 11 violating runs, the signal is clear: energy inflation operates in a fundamentally unstable process, constantly subjected to external shocks and disruptions.
The process center is markedly higher at 9.074678 with a broad standard deviation of 3.310287, reflecting the inherently erratic nature of energy pricing. The data from 2020 to early 2022 include several consecutive values far above the UCL, including peaks exceeding 40%. These extreme observations reflect global supply shocks, geopolitical instability, and post-COVID energy market adjustments.
Following the inflation peak, the chart transitions to a prolonged phase of negative or near-zero year-over-year changes. These values fall below the LCL, suggesting strong disinflation in energy prices. This shift is likely a result of base effects and reversion to normal demand and supply conditions after the spike. The behavior underscores the importance of treating energy inflation as a separate process in inflation targeting and forecasting.
Median CPI Fuels and Utilities (CUUR0000SAH2)
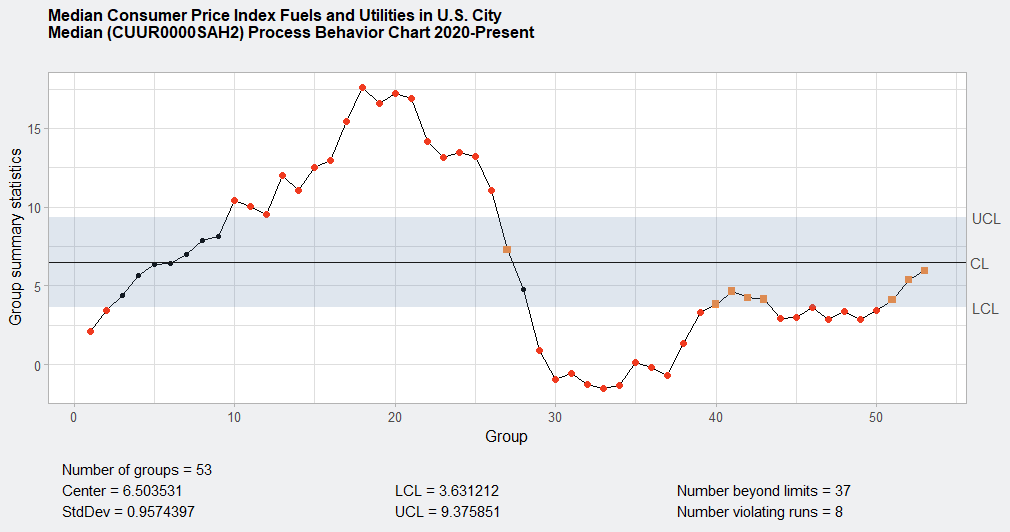
The fuels and utilities subgroup exhibits characteristics that fall between core and energy CPI. This chart also shows significant volatility, especially from 2021 through early 2023, with 37 points beyond control limits and 8 violating runs. The process center is 6.503531 and standard deviation is 0.9574397, suggesting a moderately volatile process.
Initially, the values trend upward with several special cause signals (points beyond the UCL), indicating external pressures likely driven by global fuel cost increases. This is consistent with pandemic-era and early-war energy shocks. However, in contrast to the general energy index, the post-peak stabilization of this subgroup is more gradual and less severe. The return to lower but still positive inflation figures in 2024 and 2025 suggests stabilization without full reversion or collapse.
The relatively narrow standard deviation and fewer violating runs than the energy subgroup indicate that although volatile, fuels and utilities follow a somewhat more contained process. The persistence of elevated values above the CL into 2024 could signal structural price adjustments, such as rate increases by utility providers or adjustments for regulatory changes.
Summary Observations
The Core CPI exhibits systemic shifts in inflation behavior, with identifiable phases of acceleration and deceleration. It now appears to be returning to a more stable process near the lower bounds.
Energy CPI behaves chaotically, driven by external, geopolitical, and supply-related shocks. Its process is not suitable for trend extrapolation due to frequent special causes.
Fuels and Utilities CPI is more stable than energy, yet still experiences periods of strong deviation. Its recent stabilization suggests a longer-term adjustment to elevated pricing.
These charts illustrate the utility of XmR analysis in distinguishing the behavior of inflation subgroups. Each subgroup requires different policy approaches. Core inflation reflects internal dynamics of demand and wage pressures, energy is supply-sensitive, and utilities may follow regulatory cycles. Visualizing these trends through XmR charts enables clearer communication of when and how inflation deviates from expected norms.
Table summary: UCL (Upper Control Limit), CL (Center Line/Mean), and LCL (Lower Control Limit) for each of the three CPI metrics shown the in Process Behavior Charts above:
| CPI Metric | Center (CL) | StdDev | Lower Control Limit (LCL) | Upper Control Limit (UCL) |
|---|---|---|---|---|
| Median Core CPI (MEDCPIM158SFRBCLE) | 4.304238 | 0.7163123 | 2.155301 | 6.453175 |
| Median Energy CPI (CPIENGSL) | 9.074678 | 3.310287 | -0.8561838 | 19.00554 |
| Median Fuels and Utilities CPI (CUUR0000SAH2) | 6.503531 | 0.9574397 | 3.631212 | 9.375851 |