Case Study: Analysis of Gross Profit Contribution for Major Customer to CUBI Benchmarks
Problem: Brian, after investing $500,000 in new information systems, felt overwhelmed by the extensive data output. Despite the system being designed by a trusted accounting firm, the information was so extensive that Brian felt he had lost his grip on the business. This, combined with a noticeable slowing down of cash flow, indicated potential issues in the business’s performance.
Key Metrics:
Gross Profit Contribution per Production Hour
Production Hours Billed vs. Production Hours Available for Billing
Planned Average Gross Profit per Production Hour
Actual Gross Profit per Hour in Sales to Major Customers
Charged Unit Benchmark Index (CUBI)
Data: Budgeted sales, materials at cost, and production hours for the year.
					# Load required libraries
library(knitr)
library(kableExtra)

# Create data frame
data <- data.frame(
  Label = c("A", "B", "C", "D", "E"),
  Description = c("Sales", "Materials at Cost Price", "Gross Profit Contribution",
                  "Production Hours", "Target Average Contribution Per Hour"),
  Value = c("$60,000,000", "$40,000,000", "$20,000,000", "250,000 hours", "$80")
)

# Ensure that all column names are properly assigned
colnames(data) <- c("Label", "Description", "Value")

# Create a customized table using kable and kableExtra with the specified caption
kable(data, format = "html",
      caption = "Table 2-1: Target Average Contribution per Hour") %>%
  kable_styling(bootstrap_options = c("striped", "hover", "condensed", "responsive"),
                full_width = FALSE, position = "left") %>%
  column_spec(1, bold = TRUE, color = "black") %>%
  row_spec(0, bold = TRUE, background = "#f2f2f2")  # Bold and highlight the header row
Table 2-1: Target Average Contribution per Hour
| Label | Description | Value |
|---|---|---|
|
A |
Sales |
$60,000,000.00 |
|
B |
Materials at Cost Price |
$40,000,000.00 |
|
C |
Gross Profit Contribution |
$20,000,000.00 |
|
D |
Production Hours |
250,000 hours |
|
E |
Target Average Contribution Per Hour |
$80 |
Note: Table 2-1 Calculations
- Label C (C=A – B)
- Label E (E=C / D)
Challenge Traditional Approaches:
Traditional Method: The company traditionally calculates gross profit by adding factory wages and expenses to the materials before deducting from sales. This method is based on the ideas that factory wages and expenses vary with production, but as pointed out in the scenario, these costs have become more fixed in nature.
Establish Benchmarks:
- Use the calculated CUBI of $80 as a benchmark.
Analyze Major Customers:
- Identify the business’s biggest customers
- Analyze a few typical invoices for these major customers.
Data: for #1 customer
					# Load required libraries
library(knitr)
library(kableExtra)

# Create data frame
data <- data.frame(
  `Invoice Number` = c("2765", "2958", "3015", "Total"),
  `Invoice Price Net of Tax ($)` = c("$100,000", "$300,000", "$150,000", "$550,000"),
  `Materials Used ($)` = c("$68,000", "$200,000", "$102,000", "$370,000"),
  `Gross Profit Contribution ($)` = c("$32,000", "$100,000", "$48,000", "$180,000"),
  `Gross Profit (%)` = c(32, 33, 32, 33),
  `# of Hours` = c(914, 3125, 1450, 5489),
  `Average $ Per Hour` = c(35, 32, 33, 33)
)

# Create a customized table using kable and kableExtra with the specified caption
kable(data, format = "html",
      caption = "Table 2-2: Invoice Analysis of Number One Customer") %>%
  kable_styling(bootstrap_options = c("striped", "hover", "condensed", "responsive"),
                full_width = TRUE, position = "center", font_size = 10) %>%
  column_spec(1, bold = TRUE) %>%
  row_spec(4, bold = TRUE, background = "#f2f2f2")  # Bold and highlight the "Total" row
Tabel 2-2: Invoice Analysis for the #1 Customer
| Invoice No. | Invoice Price Net of Tax ($) A | Materials Used (S) B | Gross Profit Contribution (S) C = A - B | Gross Profit (%) D+ C/A | No. of Hrs E | Avg (S) Per Hr F = C/E |
|---|---|---|---|---|---|---|
|
2765 |
$100,000 |
$68,000 |
$32,000 |
32 |
914 |
35 |
|
2958 |
$300,000 |
$200,000 |
$100,000 |
33 |
3125 |
32 |
|
3015 |
$150,000 |
$102,000 |
$48,000 |
32 |
1450 |
33 |
|
Total |
$550,000 |
$370,000 |
$180,000 |
33 |
5489 |
33 |
Note: Table 2-2 Calculations
- Invoice Price of Net of Tax ($) (A)
- Materials Used (B)
- Gross Profit Contribution ($) (C = A – B)
- Gross Profit (%) (D = C / A)
- # of Hours (E)
- Average $ Per Hours (F = C / A)
Compare Actual Performance to Benchmarks:
Compare the actual gross profit contribution per production hour from major customers to the CUBI.
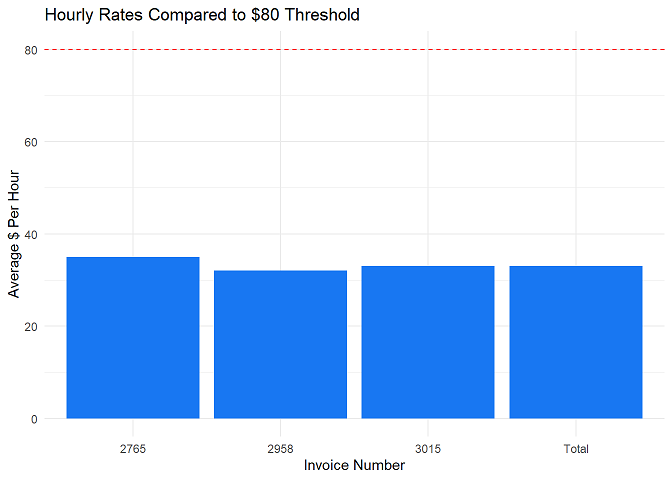
The analysis revealed that the company is getting an average gross profit contribution of $33 per hour from its largest customer who is taking 55% of output when the required average, based on the CUBI, is $80.
This significant discrepancy indicates that the business’s performance, at least with respect to this major customer, is falling short of the target benchmarks.
Data: Hour Rates Compared to $80 Threshold
					# Load required libraries
library(ggplot2)
library(scales)
# Create a data frame with the given values and corresponding invoice numbers
data <- data.frame(
  Invoice = c("2765", "2958", "3015", "Total"),
  Value = c(35, 32, 33, 33)
)

# Create a ggplot
plot <- ggplot(data, aes(x = Invoice, y = Value)) +
  geom_bar(stat = "identity", fill = "#1877F2", aes(fill = ifelse(Value < 80, "below", "above"))) +
  geom_hline(yintercept = 80, color = "red", linetype = "dashed") +
  labs(title = "Hourly Rates Compared to $80 Threshold",
       x = "Invoice Number",
       y = "Average $ Per Hour",
       fill = "Position") +

  theme_minimal()

print(plot)
Chart: Hour Rates Compared to $80 Threshold
Determine Implications:
Calculate the implications of the current performance on the business’s overall goals.
Data: Implications of current performance
					# Given data and calculations

# A: 250,000 hours * 80
A_result <- 250000 * 80

# B: (250,000 * 55%)
B_result <- 250000 * 0.55

# C: 137,500 hours * $33
C_result <- 137500 * 33

# D: Balance Required (assuming it's A - C)
D_result <- A_result - C_result

# E: Hours Available (250,000 hours – 137,500)
E_result <- 250000 - 137500

# F: Average Rate per Hour Required (assuming it's D / E)
F_result <- D_result / E_result

# Format results with commas and two decimal places
formatted_results <- c(format(A_result, big.mark=",", scientific=FALSE, digits=2),
                       format(B_result, big.mark=",", scientific=FALSE, digits=2),
                       format(C_result, big.mark=",", scientific=FALSE, digits=2),
                       format(D_result, big.mark=",", scientific=FALSE, digits=2),
                       format(E_result, big.mark=",", scientific=FALSE, digits=2),
                       format(round(F_result, 2), big.mark=",", scientific=FALSE, digits=2)) # Round F_result to 2 decimal places

# Display results
results <- data.frame(
  Item = c("A", "B", "C", "D", "E", "F"),
  Result = formatted_results
)


# Load the necessary libraries
library(knitr)
library(kableExtra)

# Provided data
data <- data.frame(
  Item = c("A", "B", "C", "D", "E", "F"),
  Value = c("20,000,000", "137,500", "4,537,500", "15,462,500", "112,500", "137.44 Average Rate Required Per Hour")
)

# Create the kable table with the same styling as the working example
kable_table <- kable(data, format = "html", col.names = c("Item", "Value"),
                     caption = "Table 2-3: Implications for Balance of Customer") %>%
  kable_styling(bootstrap_options = c("striped", "hover", "condensed", "responsive"),
                full_width = F, position = "center", font_size = 10) %>%
  column_spec(1, bold = T) %>%
  row_spec(0, bold = T)  # Make the header row bold

# Print the kable table
kable_table
Table 2-3: Implications for Balance of Customer
| Item | Calculations | Value |
|---|---|---|
|
A |
250,000 * $80 = |
$20,000,000 |
|
B |
(250,000 * 55%) = |
137,500 |
|
C |
137,500 hours* $33 = |
$4,537,500 |
|
D = (A - C) |
Balance Required = |
$15,462,500 |
|
E |
Hours Available (250,000 hours - 137, 500) = |
112,500 hours |
|
F = (D / E) |
Average Rate per Hour Required = |
$137.44 |
Note: Table 2-3 Calculations
- Label D (A – C)
- Label F (E = D / E)
Recommendations Solutions
Feedback & Reporting
Reflect on Analysis
Recommendations Solutions:
Improving Efficiency in Production
- Reduce Production Hours for Major Customers: Consider reducing the number of production hours scheduled for your best customer.
- Re-evaluate Production Processes: Identify inefficiencies or bottlenecks.
- Training and Skill Development: Invest in training programs.
- Reducing Costs:
- Material Costs Reduction: Explore ways to reduce material costs.
- Minimize Waste: Implement strategies to cut back on waste.
- Re-evaluate Fixed Costs: Review fixed costs.
Feedback and Reporting:
- Emphasize the importance of timely and relevant feedback.
Reflect on Analysis:
- Reflect on the findings and their implications for the business.
Recommend Further Analysis (if necessary):
- Recommend further in-depth analysis if the initial analysis reveals significant issues.