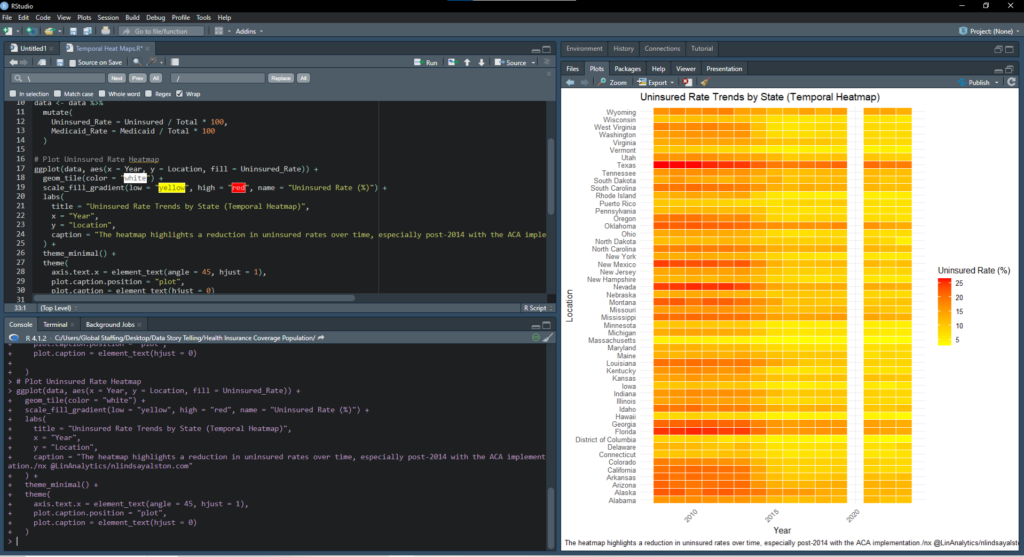

is a programming language and software environment primarily used for statistical computing and data analysis. It’s popular among data scientists, statisticians, and researchers for its powerful data manipulation, visualization, and modeling capabilities. Here’s a brief overview of what makes R unique and widely used:
- Statistical Analysis and Data Science: R is designed with statistical analysis in mind, making it a go-to tool for conducting a wide range of statistical tests, regressions, and analyses.
- Data Visualization: R has extensive visualization libraries like ggplot2, which allow users to create high-quality, customizable graphs and charts, making data insights more accessible and understandable.
- Open-Source and Free: R is open-source, meaning it’s free to use and has a large, active community that contributes packages, tools, and resources. The Comprehensive R Archive Network (CRAN) hosts thousands of packages that extend R’s capabilities.
- Used for Machine Learning and Predictive Modeling: R includes libraries for machine learning, making it useful for building predictive models and performing complex analyses.
- Integration with Other Tools: R integrates well with other programming languages and tools, such as Python, SQL, and Hadoop, as well as with data visualization platforms like Tableau and Power BI.
- RStudio: R’s development environment, RStudio, is an integrated development environment (IDE) that provides a user-friendly interface for coding, running analyses, and managing projects.
In summary, R is a versatile and powerful tool for data analysis, visualization, and statistical computing, with applications in academia, industry, finance, healthcare, and more.