Image 1: click to enlarge
Introduction
Over the past six months, I’ve been tracking one specific metric every single day: the number of impressions on my LinkedIn posts. What began as a simple curiosity to “see what’s working” turned into a case study in process behavior — and one that fundamentally reshaped how I view performance, engagement, and growth.
I didn’t want to rely on gut feelings. I wanted proof of whether my efforts were actually producing change — not just noise.
So I built an XmR chart to monitor the process over time.
This Isn’t Just About LinkedIn
If you’re a business leader, content creator, or data analyst trying to make sense of what’s working, this method of analysis can reveal what most dashboards won’t:
When you’re truly getting better — and when you’re just reacting to randomness.
In this reflection, I’ll walk through the chart, share what it taught me, and explain how it led to more intentional, repeatable performance.
The Core Insight:
Growth becomes visible only when you understand variation.
Once I started viewing my impressions as a process — with ups and downs expected — I could distinguish signal from noise.
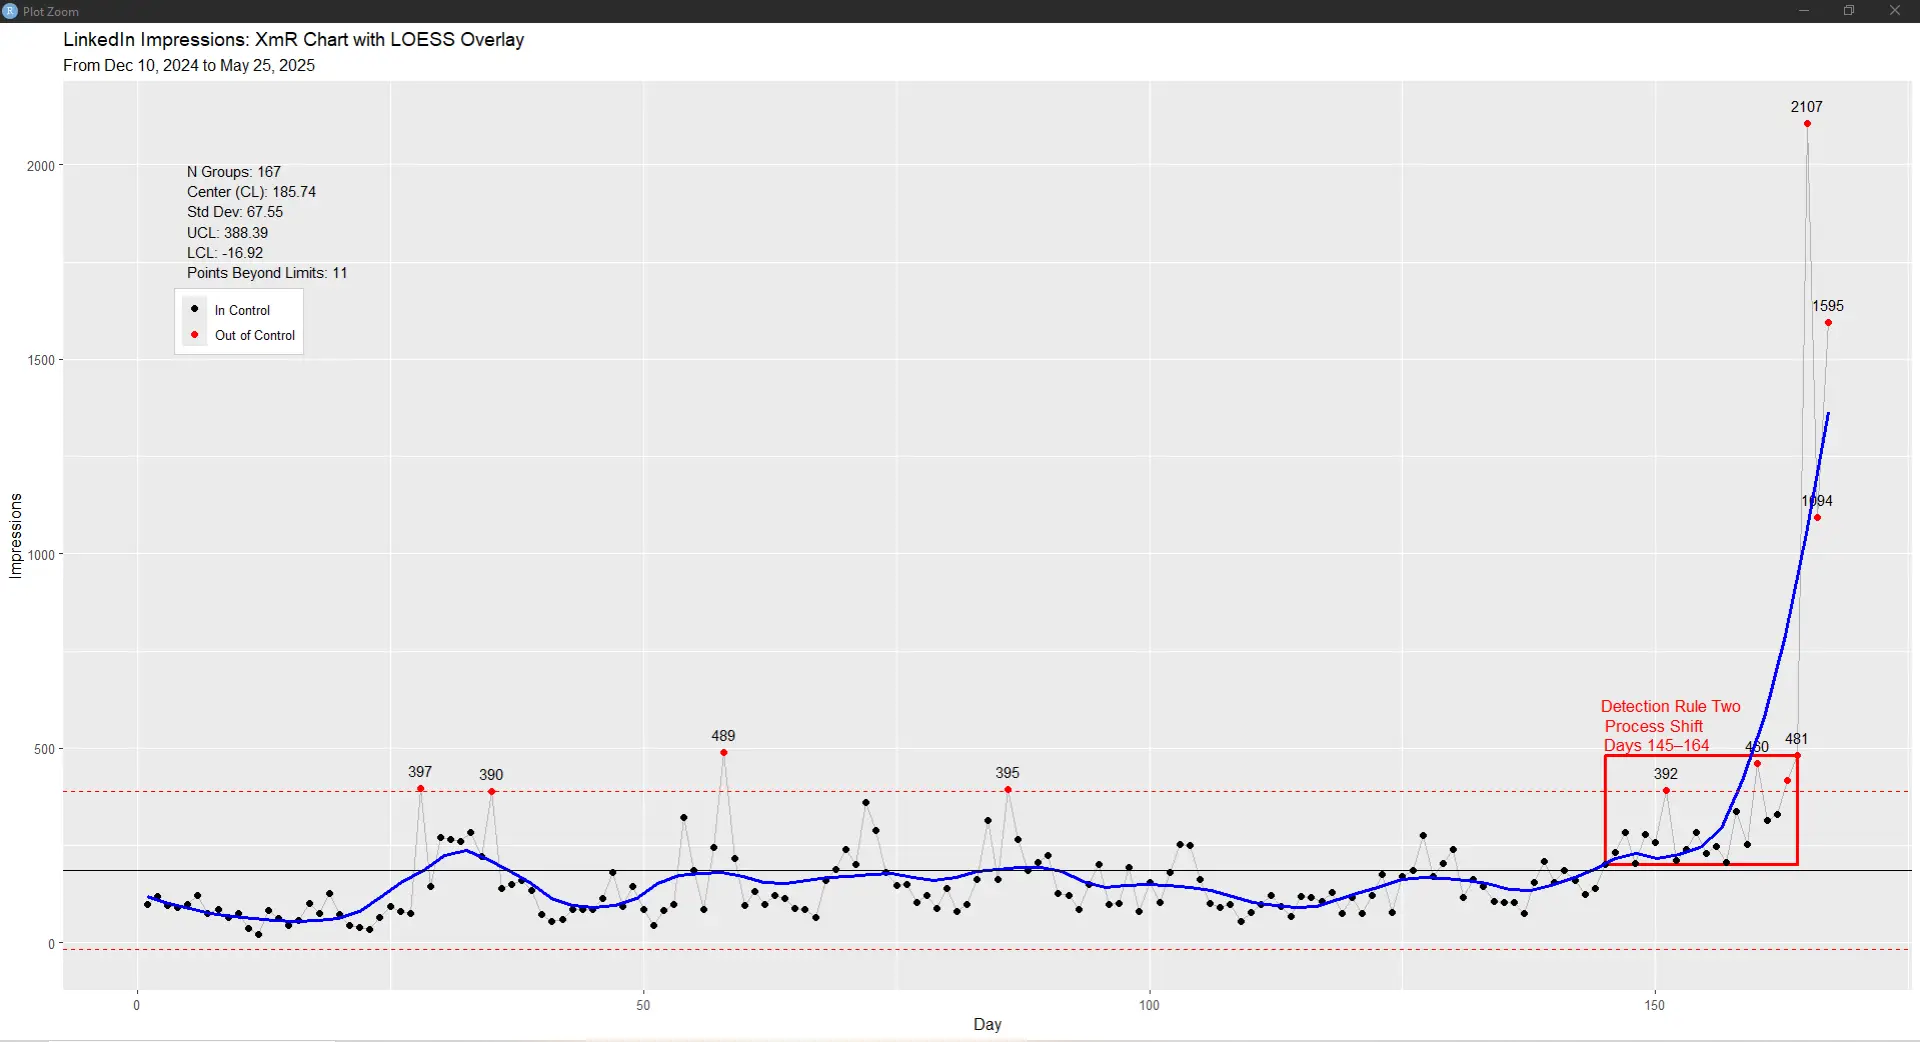
For example: That viral spike near Day 167 (2,107 impressions) felt like a big win. But what changed my behavior was the pattern that preceded it — not the peak itself.
What looked like one-off success was actually the result of a sustained shift in system behavior.
Walking Through The Chart
Here’s how the story unfolds:
- Initial Baseline (Day 0–144):
The average number of impressions hovered around 185.74, with most values falling between 0 and ~388. Everything in this band was “normal variation.” A few days popped above 390, but they didn’t sustain. The process was stable, predictable, and unimpressive. - Early Signals of Change (Day 145–164):
Something new emerged — a consistent run of 8 out of 10 days above the baseline. That triggered Detection Rule Two: a sign of a potential process shift. This wasn’t noise anymore. The system was behaving differently. Something had changed — in how I wrote, posted, or connected. - Breakout (Days 165–167):
Suddenly, impressions exploded — 1,094, then 1,595, then 2,107. These are special cause signals, not just good luck. They built on the momentum created during the process shift. This is the result of cumulative small changes reaching a tipping point.
The blue LOESS curve confirms this progression: flat in the beginning, slowly rising mid-process, then curving steeply upward.
Did the LOESS Curve Catch The Shift?
Yes — but only after the fact.
LOESS (Locally Estimated Scatterplot Smoothing) is a flexible smoothing technique that fits localized regressions to data. In the chart, the blue LOESS line adds a useful visual trendline that feels right to the eye — especially as the curve starts climbing just after Day 150.
But here’s the catch:
LOESS is reactive, not diagnostic.
It follows the data — it doesn’t alert you to when a process actually changes.
While the LOESS line rises in response to the surge in impressions, it lags behind the actual behavioral shift detected by XmR rules. It saw the breakout, but it couldn’t detect the moment when the system behavior fundamentally changed (Days 145–164).
Contrast that with the XmR chart, which flagged the shift using control rules before the big breakout ever happened. That’s the real value of process behavior thinking: it gives you early insight, not just hindsight.
The Common Mistake This Challenges:
Most people (my past self included) assume success happens when a post “goes viral.” So we chase performance, not process. But that’s reactive.
A better way is to ask:
“Has my system improved?”
The XmR chart answers this. It separates temporary highs from lasting improvements. That’s why this chart isn’t just descriptive — it’s diagnostic.
So What’s Next?
This chart tells me the baseline has shifted — permanently. I’ll soon calculate a new centerline using only post-shift data to reflect this upgraded process.
And I’ll explore:
- Which posts preceded the shift?
- What behaviors contributed to it?
- Can I build a repeatable system around those patterns?
But even if I stopped here, this chart gave me something I never had before:
The ability to connect actions to results — without guessing.
Final Takeway:
Once you see your content (or performance) as a system, not a series of flukes, everything changes.
You stop chasing spikes and start shaping your process.
This approach applies far beyond LinkedIn:
- Revenue trends
- Marketing conversions
- Operational KPIs
It’s not just about impressions — it’s about understanding variation, so you can create sustainable growth.
If you’re tired of guessing whether what you’re doing is working, try using an XmR chart.
Because the moment you understand what’s really changing — not just what looks impressive — is the moment you start to take control.