Inflation and taxes directly impact your income, creating a gap between nominal wages (the actual amount on your paycheck) and real wages (the purchasing power of that paycheck over time). This article explains the differences between nominal and real wages and introduces an interactive tool to help you visualize how inflation and taxes affect your income over the years.
Understanding Nominal and Real Wages
Nominal Wage: This is your gross income before adjusting for inflation or taxes. It’s the “face value” of your earnings, the number on your paycheck, but it doesn’t account for factors that affect your purchasing power.
Real Wage: Real wage reflects your income’s purchasing power, adjusting for inflation and taxes. It considers how much of your nominal wage you can actually spend on goods and services as prices rise over time.
How Inflation Affects Wages
Inflation represents the general increase in prices across an economy, eroding the value of money. As inflation rises, the same nominal wage buys less, reducing purchasing power unless wages increase to keep up. If nominal wages don’t rise with inflation, your real wage declines, meaning your effective earnings decrease over time.
How Taxes Impact Real Wages
Tax brackets impact your take-home pay. For instance, a single filer in the U.S. faces progressive tax rates, meaning the rate increases as income rises. The dashboard tool includes the 2024 U.S. federal tax brackets to show how taxes reduce nominal income, helping you see what portion of your wage is effectively yours to spend.
Introducing the Nominal vs. Real Wage Dashboard
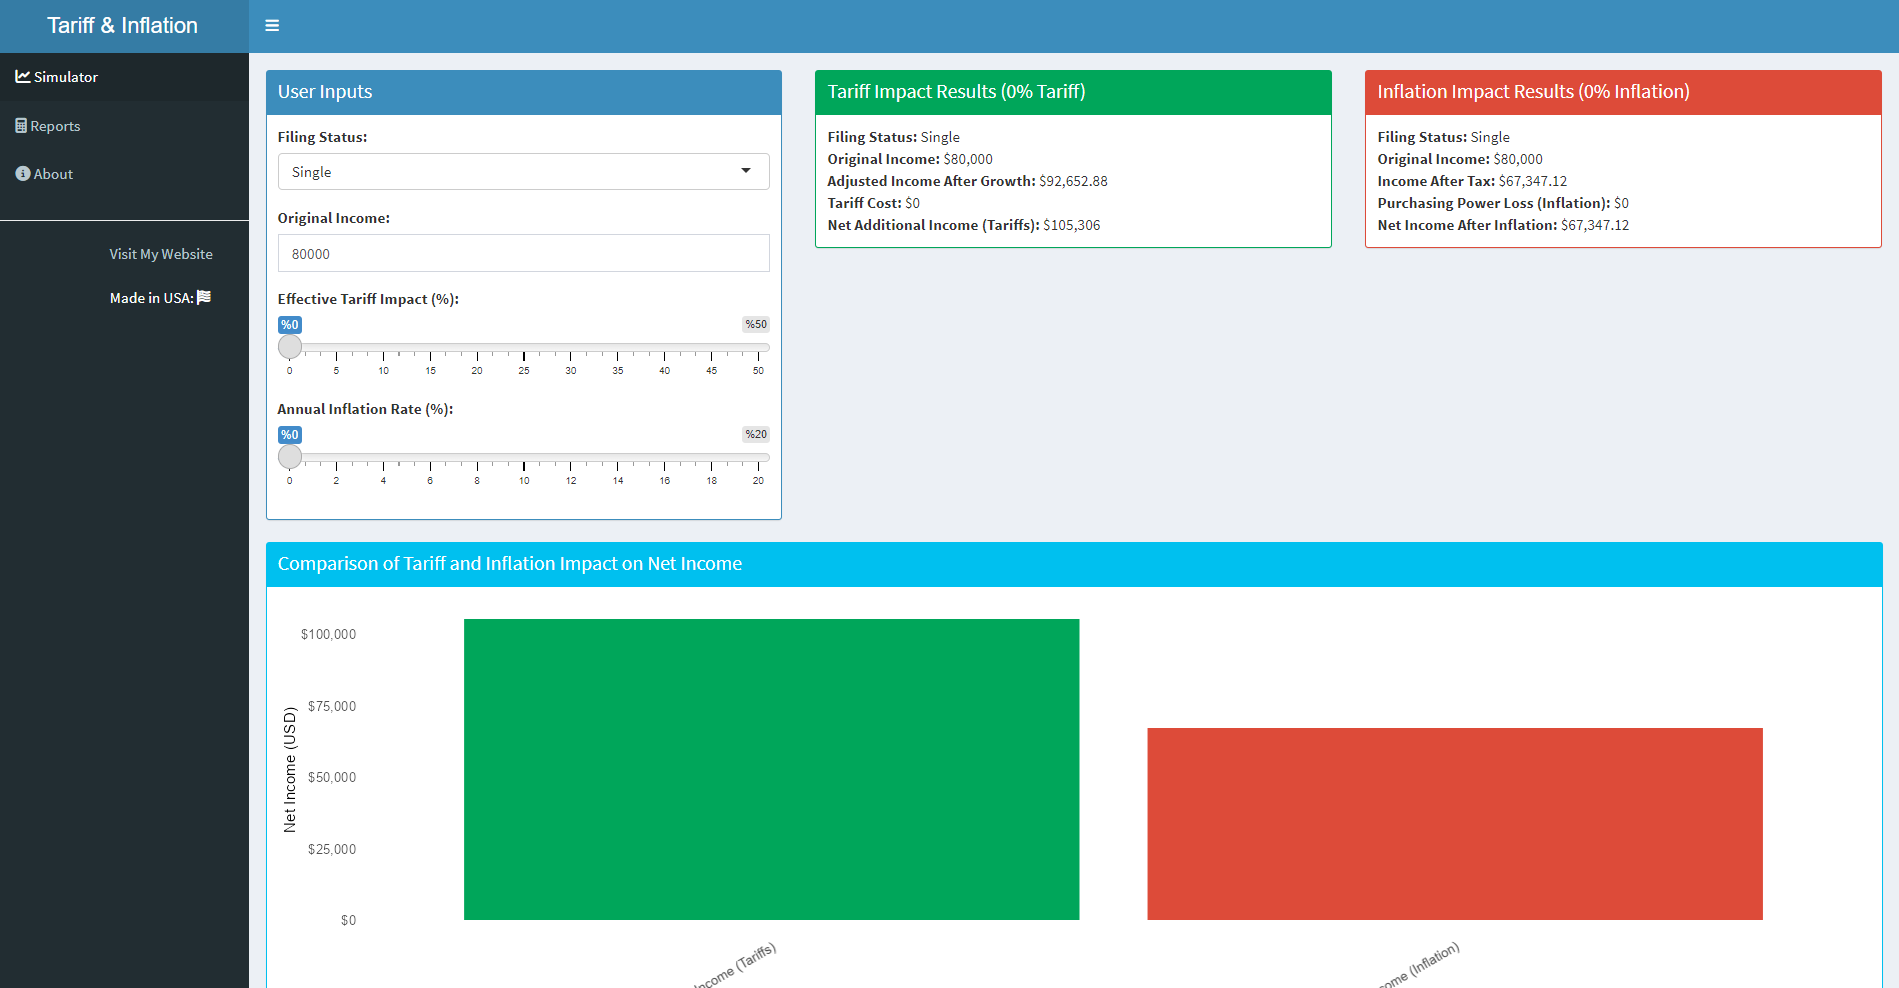
Our Shiny dashboard lets you explore the interaction between inflation, taxes, and income over time. With it, you can input variables like your starting wage, tax filing status, projected inflation rate, and the number of years for the projection. It then calculates your real wage and visualizes the impact of inflation and taxes on your purchasing power.
Features and Insights Provided by the Dashboard
- Real vs. Nominal Wage Over Time
- Visualize how much of your nominal wage remains as real wage over the selected years. The dashboard plots two lines: one showing nominal wage (without adjustments) and another showing real wage (after accounting for inflation and taxes). This helps illustrate how inflation gradually erodes purchasing power.
- Real Wage vs. Consumer Price Index (CPI)
- CPI data from the Federal Reserve Economic Data (FRED) serves as a benchmark for inflation. By comparing your adjusted real wage against CPI, you can see if your wages keep pace with inflation. A rising CPI alongside a declining real wage suggests a shrinking ability to afford goods and services.
- Wage Gap Analysis
- The wage gap, or the difference between nominal and real wages, quantifies the combined impact of taxes and inflation. This metric reveals how much of your income you lose in purchasing power due to economic factors.
- Dynamic Analysis Summary
- The dashboard generates an analysis based on real wage trends and CPI. For example, if your real wage trend is negative while CPI rises, it signals a decline in purchasing power, indicating that wages aren’t keeping up with inflation.
Using the Dashboard for Financial Planning
By entering your income and seeing how inflation and taxes affect it, you gain insights into:
- Long-term purchasing power: Understand how much income you’ll need to maintain your current lifestyle as prices increase.
- Budgeting and saving strategies: Plan for savings and investments to offset declining purchasing power.
- Salary negotiation insights: Use this knowledge to justify wage increases, demonstrating the impact of inflation on your income.
Conclusion
Inflation and taxes are essential considerations in financial planning, often eroding purchasing power over time. By understanding nominal vs. real wages, you can take proactive steps to ensure that your income keeps up with rising costs, whether through salary negotiations, investments, or budget adjustments. Use our interactive tool to see how these factors impact your income trajectory and make data-driven financial decisions for a stable future.