Overview of the Chart
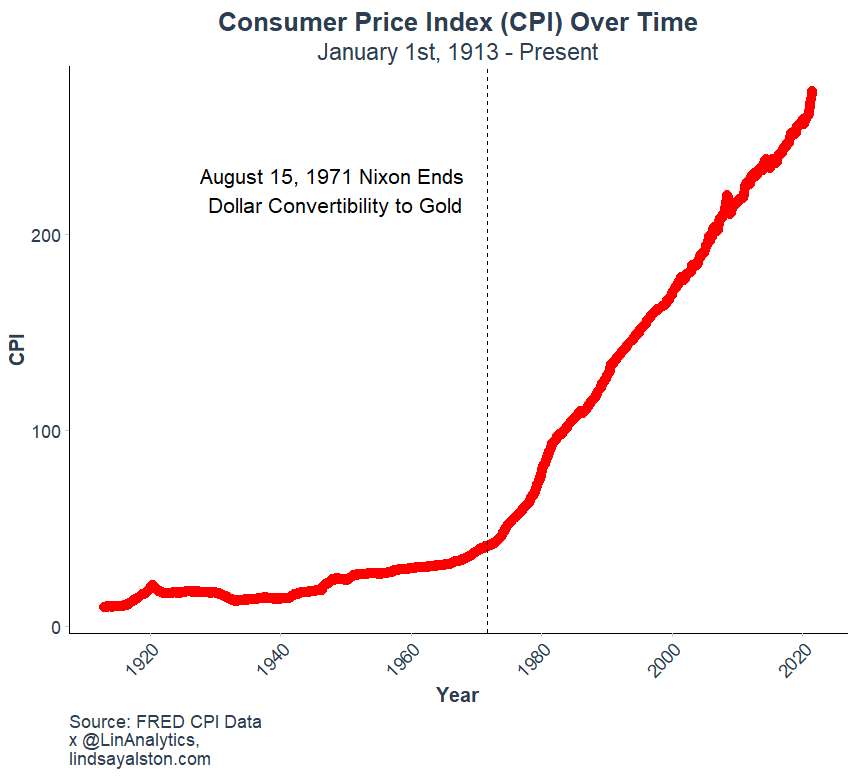
This chart shows the Consumer Price Index (CPI) Over Time from January 1, 1913, to the present, highlighting a significant shift in inflation trends. The CPI remained relatively stable and grew gradually from 1913 to the early 1970s, reflecting an era when the U.S. dollar was backed by gold. However, after August 15, 1971, when President Nixon ended the dollar’s convertibility to gold, the CPI began to rise sharply. This policy shift, which marked the transition to a fiat currency system, coincides with a dramatic and sustained increase in inflationary pressures, as reflected in the steep upward trajectory of the CPI line.
Statistical Analysis of CPI Trends
To statistically assess the impact of this policy change, an independent two-sample t-test was conducted to compare the mean CPI before and after August 15, 1971. The results indicate a highly significant difference in the means, with a t-value of -53.308 and a p-value less than 2.2e-16, far below the conventional significance threshold of 0.05. The mean CPI before 1971 was 21.26, while the mean CPI after 1971 surged to 154.77, representing a substantial increase. The 95% confidence interval for the difference in means, ranging from -138.42 to -128.60, further confirms that this shift is not due to random chance.
Implications of the Findings
These findings underscore the profound economic implications of abandoning the gold standard. The move to a fiat currency system allowed for greater monetary policy flexibility but also introduced the potential for sustained inflation. The sharp rise in CPI post-1971 aligns with this policy change, offering both a visual and statistical demonstration of how significant monetary shifts can reshape the economy over time.