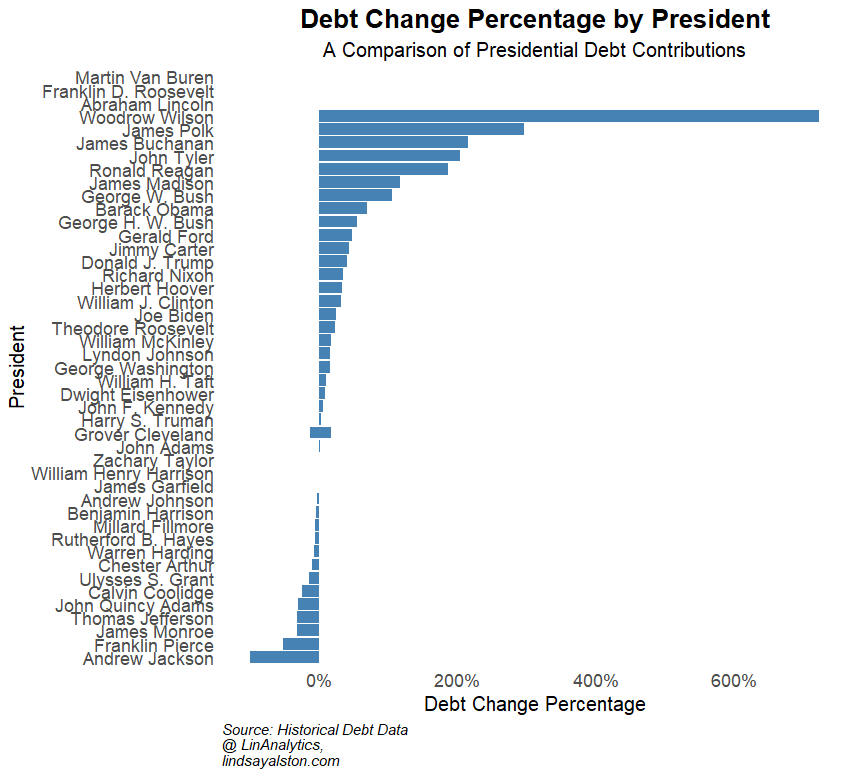
The chart illustrates the Debt Change Percentage by U.S. Presidents, highlighting significant variations in debt changes across different administrations. Notably, outliers such as Abraham Lincoln, Franklin D. Roosevelt, and Martin Van Buren exhibit dramatic debt increases, with percentages exceeding 600%, although their exact values are not fully displayed due to the chart’s axis limits. These extreme changes are likely tied to pivotal historical events. For instance, Abraham Lincoln’s presidency saw a significant rise in national debt due to financing the Civil War, while Franklin D. Roosevelt’s administration faced unprecedented spending during the Great Depression and World War II. Similarly, Martin Van Buren’s era was marked by significant fiscal challenges that drove large percentage increases.
In contrast, more recent presidents such as Ronald Reagan, Barack Obama, and George W. Bush show moderate debt increases, reflecting modern fiscal trends driven by economic policies, military engagements, and financial crises. For example, the 2008 financial crisis and the COVID-19 pandemic contributed to high debt levels under Barack Obama and Donald Trump, respectively. Presidents like Andrew Jackson and Franklin Pierce, however, show little to no debt increases, reflecting the limited federal government spending during their terms in the 19th century.